Exam 17: The Short-Run Trade-Off Between Inflation and Unemployment
Exam 1: Ten Principles of Economics347 Questions
Exam 2: Thinking Like an Economist528 Questions
Exam 3: Interdependence and the Gains From Trade413 Questions
Exam 4: The Market Forces of Supply and Demand568 Questions
Exam 5: Measuring a Nations Income428 Questions
Exam 6: Measuring the Cost of Living420 Questions
Exam 7: Production and Growth417 Questions
Exam 8: Saving, Investment, and the Financial System473 Questions
Exam 9: The Basic Tools of Finance419 Questions
Exam 10: Unemployment562 Questions
Exam 11: The Monetary System421 Questions
Exam 12: Money Growth and Inflation384 Questions
Exam 13: Open-Economy Macroeconomic Models447 Questions
Exam 14: A Macroeconomic Theory of the Open Economy375 Questions
Exam 15: Aggregate Demand and Aggregate Supply466 Questions
Exam 16: The Influence of Monetary and Fiscal Policy on Aggregate Demand416 Questions
Exam 17: The Short-Run Trade-Off Between Inflation and Unemployment367 Questions
Exam 18: Six Debates Over Macroeconomic Policy235 Questions
Select questions type
If inflation expectations decline, then the short-run Phillips curve shifts
(Multiple Choice)
4.8/5  (31)
(31)
In the long run, the natural rate of unemployment depends primarily on the growth rate of the money supply.
(True/False)
4.8/5 (34)
The Phillips curve and the short-run aggregate supply curve are closely related, yet one slopes downward and the other slopes upward. Discuss.
(Essay)
4.8/5 (34)
Country A's long-run Phillips curve is farther to the right than country B's. Country A and country B are identical in all other ways. In particular, they have the same money supply growth rates. In the long run as compared to country B country A will have
(Multiple Choice)
4.7/5 (40)
Which of the following shifts the long-run Phillips curve left?
(Multiple Choice)
4.8/5 (38)
In the long run, a decrease in the money supply growth rate
(Multiple Choice)
4.9/5 (42)
If the economy is at the point where the short-run Phillips curve intersects the long-run Phillips curve,
(Multiple Choice)
4.9/5 (39)
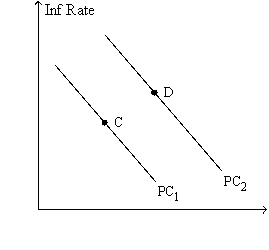
Figure 17-8. The left-hand graph shows a short-run aggregate-supply (SRAS) curve and two aggregate-demand (AD) curves. On the right-hand diagram, "Inf Rate" means "Inflation Rate."
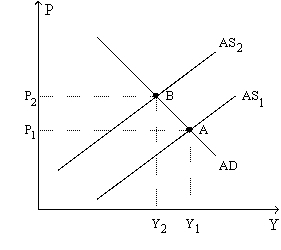
 -Refer to Figure 17-8. What is measured along the horizontal axis of the right-hand graph?
(Multiple Choice)
4.9/5 (38)
Figure 17-8. The left-hand graph shows a short-run aggregate-supply (SRAS) curve and two aggregate-demand (AD) curves. On the right-hand diagram, "Inf Rate" means "Inflation Rate."
-Refer to Figure 17-8. Faced with the shift of the Phillips curve from PC1 to PC2, policymakers will
(Multiple Choice)
4.8/5 (43)
An adverse supply shock shifts the short-run Phillips curve right. If people raise their inflation expectations, the short-run Phillips curve shifts farther right.
(True/False)
4.9/5 (41)
In 1980, the combination of inflation and unemployment the U.S. was experiencing
(Multiple Choice)
4.9/5 (41)
Figure 17-2
Use the pair of diagrams below to answer the following questions.
 -Refer to Figure 17-2. If the economy starts at C and 1, then in the short run, an increase in government expenditures moves the economy to
(Multiple Choice)
4.7/5 (41)
If unemployment is above its natural rate, what happens to move the economy to long-run equilibrium?
(Multiple Choice)
4.8/5 (34)
If the Fed were to increase the money supply, inflation would increase and unemployment would decrease in the short run.
(True/False)
4.9/5 (46)
A decrease in government expenditures serves as an example of an adverse supply shock.
(True/False)
4.8/5 (35)
If the Federal Reserve increases the growth rate of the money supply, in the long run
(Multiple Choice)
4.9/5 (32)
Figure 17-6
Use the two graphs in the diagram to answer the following questions.
 -Refer to Figure 17-6. Starting from C and 3, in the short run an unexpected increase in money supply growth moves the economy to
(Multiple Choice)
4.8/5 (34)
Figure 17-7
Use this graph to answer the questions below.
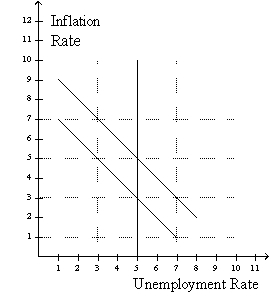 -Refer to figure 17-7. If the economy starts at 5% unemployment and 5% inflation then if the Federal Reserve pursues a contractionary monetary policy, in the short run the economy moves to
(Multiple Choice)
4.9/5 (31)
Filters
- Essay(0)
- Multiple Choice(0)
- Short Answer(0)
- True False(0)
- Matching(0)