Exam 17: The Short-Run Trade-Off Between Inflation and Unemployment
Exam 1: Ten Principles of Economics347 Questions
Exam 2: Thinking Like an Economist528 Questions
Exam 3: Interdependence and the Gains From Trade413 Questions
Exam 4: The Market Forces of Supply and Demand568 Questions
Exam 5: Measuring a Nations Income428 Questions
Exam 6: Measuring the Cost of Living420 Questions
Exam 7: Production and Growth417 Questions
Exam 8: Saving, Investment, and the Financial System473 Questions
Exam 9: The Basic Tools of Finance419 Questions
Exam 10: Unemployment562 Questions
Exam 11: The Monetary System421 Questions
Exam 12: Money Growth and Inflation384 Questions
Exam 13: Open-Economy Macroeconomic Models447 Questions
Exam 14: A Macroeconomic Theory of the Open Economy375 Questions
Exam 15: Aggregate Demand and Aggregate Supply466 Questions
Exam 16: The Influence of Monetary and Fiscal Policy on Aggregate Demand416 Questions
Exam 17: The Short-Run Trade-Off Between Inflation and Unemployment367 Questions
Exam 18: Six Debates Over Macroeconomic Policy235 Questions
Select questions type
Other things the same, an increase in aggregate demand reduces unemployment and raises inflation in the short run.
(True/False)
4.8/5  (41)
(41)
A rightward shift of the short-run aggregate-supply curve results in a more favorable trade-off between inflation and unemployment.
(True/False)
4.8/5 (30)
If the long-run Phillips curve shifts to the left, then for any given rate of money growth and inflation the economy has
(Multiple Choice)
4.9/5 (32)
The economy is in long-run equilibrium when Senator Soldout argues that the Fed should do more to fight unemployment. He argues that if the Fed increased the money supply faster, more workers would find jobs. The Senator's argument
(Multiple Choice)
4.9/5 (39)
As the aggregate demand curve shifts leftward along a given aggregate supply curve,
(Multiple Choice)
4.9/5 (38)
Figure 17-3. The left-hand graph shows a short-run aggregate-supply (SRAS) curve and two aggregate-demand (AD) curves. On the left-hand diagram, Y represents output and on the right-hand diagram, U represents the unemployment rate.
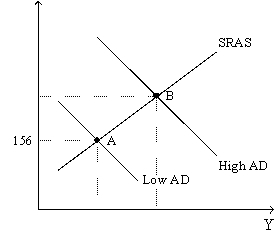
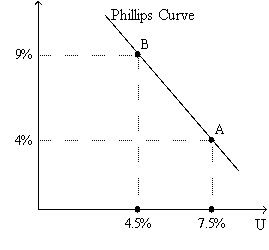 -Refer to Figure 17-3. Assume the figure charts possible outcomes for the year 2018. In 2018, the economy is at point B on the left-hand graph, which corresponds to point B on the right-hand graph. Also, point A on the left-hand graph corresponds to A on the right-hand graph. The price level in the year 2018 is
(Multiple Choice)
4.9/5 (35)
Samuelson and Solow believed that the Phillips curve offered policymakers a menu of possible economic outcomes.
(True/False)
4.9/5 (41)
Suppose that the central bank unexpectedly increases the growth rate of the money supply. In the short run the effects of this are shown by
(Multiple Choice)
4.9/5 (39)
If policymakers increase aggregate demand, then in the short run the price level
(Multiple Choice)
4.8/5 (47)
If expected inflation increases, which of the following shifts right?
(Multiple Choice)
4.9/5 (32)
If people believe that the central bank is going to reduce inflation
(Multiple Choice)
4.8/5 (38)
If the minimum wage increased, then at any given rate of inflation
(Multiple Choice)
4.7/5 (41)
According to the Phillips curve, unemployment and inflation are negatively related in
(Multiple Choice)
4.8/5 (33)
Which of the following would cause the price level to fall and output to rise in the short run?
(Multiple Choice)
4.9/5 (33)
An adverse supply shock shifts the short-run Phillips curve right and the short-run aggregate-supply curve left.
(True/False)
4.9/5 (45)
In the long run, if the Fed decreases the rate at which it increases the money supply,
(Multiple Choice)
4.7/5 (35)
An adverse supply shock shifts the short-run Phillips curve to the
(Multiple Choice)
4.9/5 (47)
Filters
- Essay(0)
- Multiple Choice(0)
- Short Answer(0)
- True False(0)
- Matching(0)