Exam 17: The Short-Run Trade-Off Between Inflation and Unemployment
Exam 1: Ten Principles of Economics347 Questions
Exam 2: Thinking Like an Economist528 Questions
Exam 3: Interdependence and the Gains From Trade413 Questions
Exam 4: The Market Forces of Supply and Demand568 Questions
Exam 5: Measuring a Nations Income428 Questions
Exam 6: Measuring the Cost of Living420 Questions
Exam 7: Production and Growth417 Questions
Exam 8: Saving, Investment, and the Financial System473 Questions
Exam 9: The Basic Tools of Finance419 Questions
Exam 10: Unemployment562 Questions
Exam 11: The Monetary System421 Questions
Exam 12: Money Growth and Inflation384 Questions
Exam 13: Open-Economy Macroeconomic Models447 Questions
Exam 14: A Macroeconomic Theory of the Open Economy375 Questions
Exam 15: Aggregate Demand and Aggregate Supply466 Questions
Exam 16: The Influence of Monetary and Fiscal Policy on Aggregate Demand416 Questions
Exam 17: The Short-Run Trade-Off Between Inflation and Unemployment367 Questions
Exam 18: Six Debates Over Macroeconomic Policy235 Questions
Select questions type
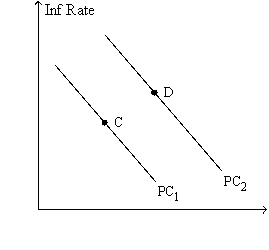
Figure 17-8. The left-hand graph shows a short-run aggregate-supply (SRAS) curve and two aggregate-demand (AD) curves. On the right-hand diagram, "Inf Rate" means "Inflation Rate."
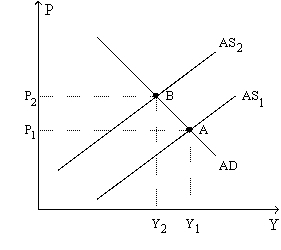
 -Refer to Figure 17-8. The shift of the aggregate-supply curve from AS1 to AS2
(Multiple Choice)
4.8/5  (31)
(31)
Which of the following is an example of an adverse supply shock?
(Multiple Choice)
4.7/5 (38)
If the government reduced the minimum wage and pursued expansionary monetary policy, then in the long run
(Multiple Choice)
4.9/5 (30)
Which of the following would cause the price level to rise and output to fall in the short run?
(Multiple Choice)
4.8/5 (43)
If unemployment is below its natural rate, what happens to move the economy to long-run equilibrium?
(Multiple Choice)
4.8/5 (41)
The short-run relationship between inflation and unemployment is often called
(Multiple Choice)
4.8/5 (45)
U.S. monetary policy in the early 1980s reduced the inflation rate by more than half.
(True/False)
4.9/5 (29)
In 2001, Congress and President Bush instituted tax cuts. According to the short-run Phillips curve, in the short run this change should have
(Multiple Choice)
4.8/5 (29)
Which of the following leads to a lower level of unemployment in the long run?
(Multiple Choice)
4.9/5 (39)
If prices and wages adjusted rapidly and producers could quickly distinguish the difference between a change in the price level and a change in the relative price of their products, then an increase in the money supply growth rate would have at most a very short-lived affect on unemployment.
(True/False)
4.8/5 (37)
If people anticipate higher inflation, but inflation remains the same then
(Multiple Choice)
4.7/5 (42)
Figure 17-1. The left-hand graph shows a short-run aggregate-supply (SRAS) curve and two aggregate-demand (AD) curves. On the right-hand diagram, U represents the unemployment rate.
 -Refer to Figure 17-1. Assuming the price level in the previous year was 100, point F on the right-hand graph corresponds to
(Multiple Choice)
4.9/5 (36)
According to the Phillips curve, unemployment and inflation are positively related in
(Multiple Choice)
4.8/5 (36)
The monetary-policy framework called inflation targeting is used explicitly by
(Multiple Choice)
4.9/5 (32)
In the long run, if there is an increase in the money supply growth rate, which of the following curves shifts right?
(Multiple Choice)
5.0/5 (33)
Figure 17-8. The left-hand graph shows a short-run aggregate-supply (SRAS) curve and two aggregate-demand (AD) curves. On the right-hand diagram, "Inf Rate" means "Inflation Rate."
-Refer to Figure 17-8. A movement of the economy from point A to point B, and at the same time a movement from point C to point D, would be described as
(Multiple Choice)
4.9/5 (33)
Sticky wages leads to a positive relationship between the actual price level and the quantity of output supplied in
(Multiple Choice)
4.8/5 (40)
Other things the same, if the central bank decreases the rate at which it increases the money supply, then in the long run
(Multiple Choice)
4.9/5 (43)
Filters
- Essay(0)
- Multiple Choice(0)
- Short Answer(0)
- True False(0)
- Matching(0)