Exam 17: The Short-Run Trade-Off Between Inflation and Unemployment
Exam 1: Ten Principles of Economics347 Questions
Exam 2: Thinking Like an Economist528 Questions
Exam 3: Interdependence and the Gains From Trade413 Questions
Exam 4: The Market Forces of Supply and Demand568 Questions
Exam 5: Measuring a Nations Income428 Questions
Exam 6: Measuring the Cost of Living420 Questions
Exam 7: Production and Growth417 Questions
Exam 8: Saving, Investment, and the Financial System473 Questions
Exam 9: The Basic Tools of Finance419 Questions
Exam 10: Unemployment562 Questions
Exam 11: The Monetary System421 Questions
Exam 12: Money Growth and Inflation384 Questions
Exam 13: Open-Economy Macroeconomic Models447 Questions
Exam 14: A Macroeconomic Theory of the Open Economy375 Questions
Exam 15: Aggregate Demand and Aggregate Supply466 Questions
Exam 16: The Influence of Monetary and Fiscal Policy on Aggregate Demand416 Questions
Exam 17: The Short-Run Trade-Off Between Inflation and Unemployment367 Questions
Exam 18: Six Debates Over Macroeconomic Policy235 Questions
Select questions type
In 2007 and 2008 households and firms reduced desired expenditures. During the same period inflation fell and unemployment rose.
(Multiple Choice)
4.7/5  (42)
(42)
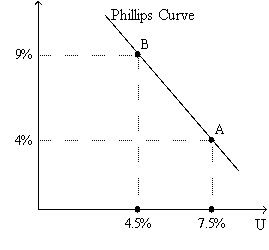
An economist working for the Central Bank of Fredonia estimates a Phillips curve for Fredonia and reports the following points on the estimated curve.  Which of the following statements is correct?
(Multiple Choice)
4.7/5 (36)
Fiscal policy cannot be used to move the economy along the short-run Phillips curve.
(True/False)
4.8/5 (39)
Some economists argue suddenly reducing money supply growth is a costly way to reduce inflation and that it may not work. For example, if a government cuts money growth but makes no real fiscal reforms, people will expect the government will eventually need to expand the money supply to pay for its expenditures. Thus, the promise to fight inflation will not be credible. Explain why credibility is important to a reduction in the inflation rate.
(Essay)
4.8/5 (35)
If an increase in inflation permanently reduced unemployment then,
(Multiple Choice)
4.7/5 (31)
According to the Phillips curve, policymakers could reduce both inflation and unemployment by
(Multiple Choice)
4.8/5 (45)
In the late 1960's, Milton Friedman and Edmund Phelps argued that a tradeoff between inflation and unemployment
(Multiple Choice)
5.0/5 (36)
As aggregate demand shifts right along the aggregate supply curve,
(Multiple Choice)
4.9/5 (38)
In 1968, economist Milton Friedman published a paper criticizing the Phillips curve on the grounds that
(Multiple Choice)
4.8/5 (42)
If a central bank wants to counter the change in the price level caused by an adverse supply shock, it could change the money supply to shift
(Multiple Choice)
4.8/5 (43)
Figure 17-7
Use this graph to answer the questions below.
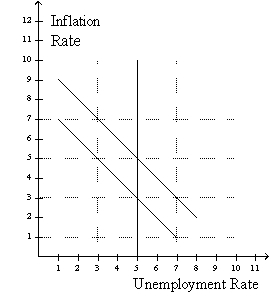 -Refer to figure 17-7. Suppose the economy starts at 5% unemployment and 3% inflation and expected inflation remains at 3%. Which one of the following points could the economy move to in the short run if the Federal Reserve pursues a more expansionary monetary policy?
(Multiple Choice)
4.9/5 (37)
According to Friedman and Phelps, the unemployment rate is above the natural rate when actual inflation
(Multiple Choice)
4.8/5 (36)
What did Friedman and Phelps predict would happen if policymakers tried to move the economy upward along the Phillips curve? Did the behavior of the economy in the late 1960s and the 1970s prove them wrong?
(Essay)
5.0/5 (32)
Figure 17-3. The left-hand graph shows a short-run aggregate-supply (SRAS) curve and two aggregate-demand (AD) curves. On the left-hand diagram, Y represents output and on the right-hand diagram, U represents the unemployment rate.
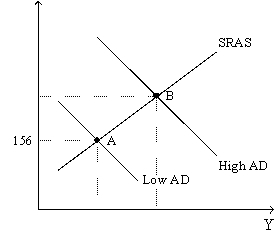
 -Refer to Figure 17-3. What is measured along the vertical axis of the right-hand graph?
(Multiple Choice)
4.9/5 (39)
Figure 17-2
Use the pair of diagrams below to answer the following questions.
 -Refer to Figure 17-2. If the economy starts at C and 1, then in the short run, an increase in taxes moves the economy to
(Multiple Choice)
4.8/5 (38)
According to classical macroeconomic theory, in the long run
(Multiple Choice)
4.9/5 (47)
Suppose a central bank announced that it was going to make a serious effort to fight inflation. A few years later the inflation rate is lower, but there had been a serious recession. We could conclude with certainty that
(Multiple Choice)
5.0/5 (29)
Figure 17-1. The left-hand graph shows a short-run aggregate-supply (SRAS) curve and two aggregate-demand (AD) curves. On the right-hand diagram, U represents the unemployment rate.
 -Refer to Figure 17-1. What is measured along the vertical axis of the right-hand graph?
(Multiple Choice)
4.7/5 (40)
Filters
- Essay(0)
- Multiple Choice(0)
- Short Answer(0)
- True False(0)
- Matching(0)