Exam 21: Building Multiple Regression Models
Exam 2: Data30 Questions
Exam 3: Surveys and Sampling28 Questions
Exam 4: Displaying and Describing Categorical Data32 Questions
Exam 5: Displaying and Describing Quantitative Data32 Questions
Exam 6: Scatterplots, Association, and Correlation32 Questions
Exam 7: Introduction to Linear Regression32 Questions
Exam 8: Randomness and Probability32 Questions
Exam 9: Random Variables and Probability Distributions28 Questions
Exam 10: Sampling Distributions28 Questions
Exam 11: Confidence Intervals for Proportions32 Questions
Exam 12: Testing Hypotheses About Proportions36 Questions
Exam 13: Confidence Intervals and Hypothesis Tests for Means36 Questions
Exam 14: Comparing Two Means32 Questions
Exam 15: Design of Experiments and Analysis of Variance Anova24 Questions
Exam 16: Inference for Counts: Chi-Square Tests26 Questions
Exam 17: Nonparametric Methods26 Questions
Exam 18: Inference for Regression32 Questions
Exam 19: Understanding Regression Residuals28 Questions
Exam 20: Multiple Regression22 Questions
Exam 21: Building Multiple Regression Models22 Questions
Exam 22: Time Series Analysis28 Questions
Exam 23: Decision Making and Risk32 Questions
Exam 24: Quality Control28 Questions
Exam 25: Exploring and Collecting Data32 Questions
Exam 26: Understanding Probability Distributions and Statistical Inference73 Questions
Exam 27: Exploring Relationships Among Variables40 Questions
Exam 28: Using Statistics for Decision Making26 Questions
Select questions type
A sample of firms was selected from the high tech industry (Industry = 1) and the financial services sector (Industry = 0). Data were collected on the following variables: turnover rate, job growth, number of employees, and innovative index (higher scores indicate a more innovative and creative organizational culture). Below are the multiple regression results. 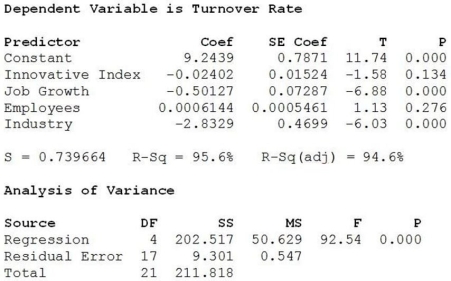 a. Write out the estimated regression equation.
b. Are all of the independent variables significant in this regression equation (using α = 0.05)? Explain.
c. Interpret the coefficient of the Industry.
d. An alternative multiple regression model is fit to these data and the results are shown below. Which model is better? Explain.
a. Write out the estimated regression equation.
b. Are all of the independent variables significant in this regression equation (using α = 0.05)? Explain.
c. Interpret the coefficient of the Industry.
d. An alternative multiple regression model is fit to these data and the results are shown below. Which model is better? Explain. 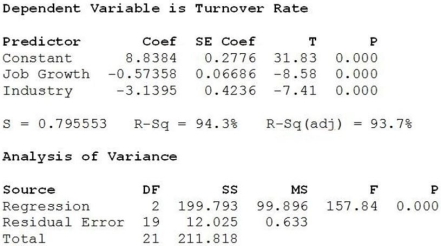 e. Based on the scatterplot below, is it appropriate to use Industry as an indicator variable in this regression model? Explain.
 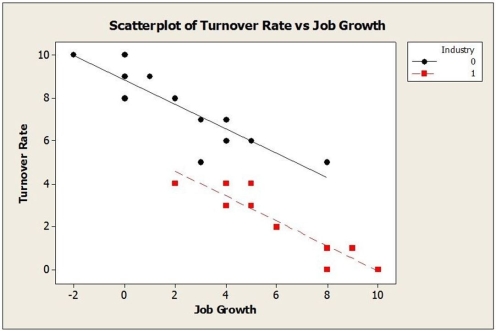 f. Using the better model, predict turnover rate for a firm in the financial services sector with 1000 employees, an innovative index of 50 and 2% job growth rate.
(Essay)
4.7/5  (42)
(42)
Consider the following to answer the question(s) below:
A sample of firms was selected from the high tech industry (Industry = 1) and the financial services sector (Industry = 0). Data were collected on the following variables: turnover rate, job growth, number of employees, and innovative index (higher scores indicate a more innovative and creative organizational culture). Below are the multiple regression results. 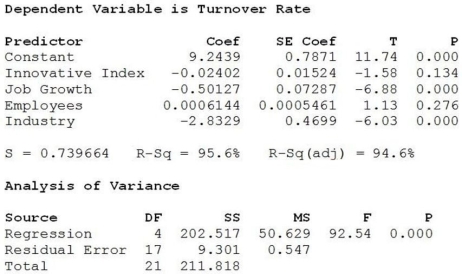 -How much of the variability in Turnover Rate is explained by the multiple regression model?
(Multiple Choice)
4.7/5 (34)
Filters
- Essay(0)
- Multiple Choice(0)
- Short Answer(0)
- True False(0)
- Matching(0)