Exam 17: Nonparametric Methods
Exam 2: Data30 Questions
Exam 3: Surveys and Sampling28 Questions
Exam 4: Displaying and Describing Categorical Data32 Questions
Exam 5: Displaying and Describing Quantitative Data32 Questions
Exam 6: Scatterplots, Association, and Correlation32 Questions
Exam 7: Introduction to Linear Regression32 Questions
Exam 8: Randomness and Probability32 Questions
Exam 9: Random Variables and Probability Distributions28 Questions
Exam 10: Sampling Distributions28 Questions
Exam 11: Confidence Intervals for Proportions32 Questions
Exam 12: Testing Hypotheses About Proportions36 Questions
Exam 13: Confidence Intervals and Hypothesis Tests for Means36 Questions
Exam 14: Comparing Two Means32 Questions
Exam 15: Design of Experiments and Analysis of Variance Anova24 Questions
Exam 16: Inference for Counts: Chi-Square Tests26 Questions
Exam 17: Nonparametric Methods26 Questions
Exam 18: Inference for Regression32 Questions
Exam 19: Understanding Regression Residuals28 Questions
Exam 20: Multiple Regression22 Questions
Exam 21: Building Multiple Regression Models22 Questions
Exam 22: Time Series Analysis28 Questions
Exam 23: Decision Making and Risk32 Questions
Exam 24: Quality Control28 Questions
Exam 25: Exploring and Collecting Data32 Questions
Exam 26: Understanding Probability Distributions and Statistical Inference73 Questions
Exam 27: Exploring Relationships Among Variables40 Questions
Exam 28: Using Statistics for Decision Making26 Questions
Select questions type
Suppose that ten new smart phone models were evaluated by two consumer electronics magazines (Popular Electronics and Electronics Now) from 1 (best) to 10 (worst) as follows. How strong is the agreement between the two magazines?
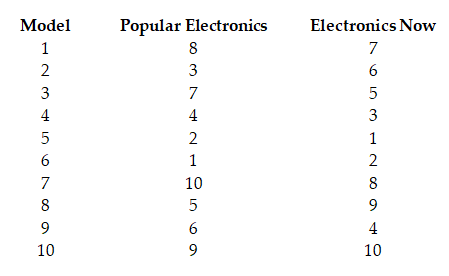 a. Why can't the Pearson correlation be used for these data?
b. The Spearman's rho is 0.745. What does this tell us about the association?
a. Why can't the Pearson correlation be used for these data?
b. The Spearman's rho is 0.745. What does this tell us about the association?
(Essay)
4.7/5  (26)
(26)
For the scatterplots shown below, indicate what about the data make nonparametric
methods appropriate for measuring the association between x and y.
a. 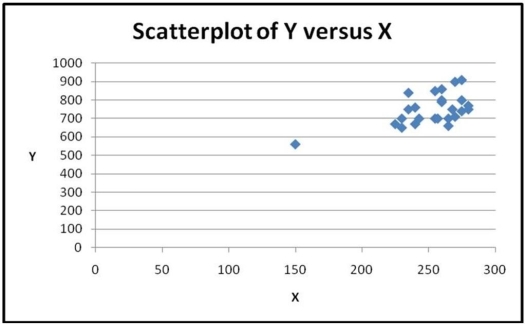 b.
b. 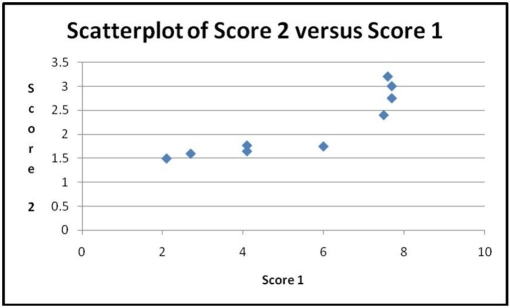
(Essay)
4.8/5 (34)
Consider the following to answer the question(s) below:
A paint manufacturer is interested in determining whether there is a difference in time it takes for two different brands of paint to dry once they have been applied to a wall surface. To test this, the company has selected a random sample of 5 walls and applied Brand 1, and another 5 walls and applied Brand 2. The following data reflect the actual drying time in hours:
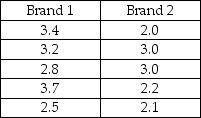 -The appropriate nonparametric method to use for these data is the
(Multiple Choice)
4.9/5 (32)
Eight hybrid cars are used to determine if there is a difference in fuel efficiency (l/100km) with and without a particular additive. Using the appropriate nonparametric method, the value of the calculated test statistic for the data shown below is
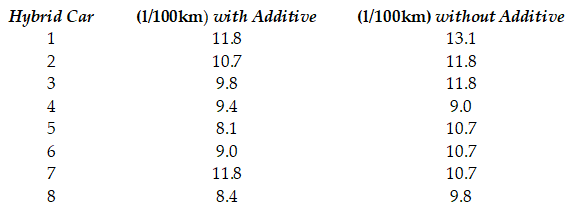
(Multiple Choice)
4.8/5 (34)
Suppose that ten new smart phone models were evaluated by two consumer electronics magazines from 1 (best) to 10 (worst). Spearman's rho was calculated to be - 0.45. We can say that
(Multiple Choice)
4.8/5 (34)
Suppose the Kruskal-Wallis test was used to compare four groups. If the test statistic value was found to be 9.545, using α = 0.05 we should
(Multiple Choice)
4.9/5 (38)
Filters
- Essay(0)
- Multiple Choice(0)
- Short Answer(0)
- True False(0)
- Matching(0)