Exam 5: Accumulating Change: Limits of Sums and the Definite Integral
Exam 1: Ingredients of Change: Functions an Limits50 Questions
Exam 2: Describing Change: Rates47 Questions
Exam 3: Determining Change: Derivatives48 Questions
Exam 4: Analyzing Change: Applications of Derivatives50 Questions
Exam 5: Accumulating Change: Limits of Sums and the Definite Integral50 Questions
Exam 6: Analyzing Accumulated Change: Integrals in Action51 Questions
Exam 7: Ingredients of Multivariable Change: Models, Graphs, Rates46 Questions
Exam 8: Analyzing Multivariable Change: Optimization50 Questions
Select questions type
Using data from the U.S. Bureau of the Census, the model 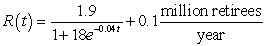 gives the projected rate of change in the number of people within one year of retirement, where t is the number of years since 1940, for the years between 1940 and 2050. Use the equation and ten midpoint rectangles to estimate, to four decimal places, the change in the population within one year of retirement or older from the end of 2037 through the end of 2042.
(Multiple Choice)
4.7/5  (27)
(27)
The function  gives the rate of change of profit for a new business during its first year. The input is the number of months since the business opened, and the output units are millions of dollars per month. What is the interpretation, in context, of the accumulation function
 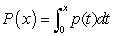 ?
?
(Multiple Choice)
4.8/5 (35)
Blood pressure varies for individuals throughout the course of a day, typically being the lowest at night and the highest from late morning to early afternoon. The estimated rate of change in diastolic blood pressure for a patient with untreated hypertension is shown in the table. Using a model for the data, estimate to one decimal place, the average rate of change in diastolic blood pressure from noon. to 8 P.M. 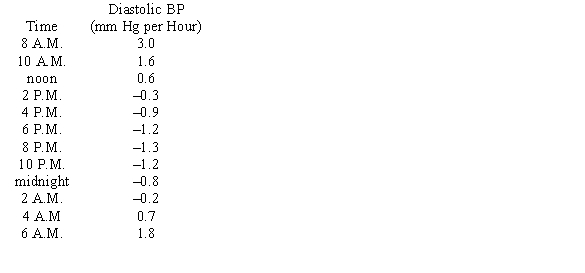
(Multiple Choice)
4.8/5 (44)
Consider the graph of the function: 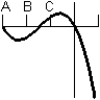 Identify, from the graphs a through f, the derivative graph and the accumulation graph (with point A as the starting point).
a:
Identify, from the graphs a through f, the derivative graph and the accumulation graph (with point A as the starting point).
a: 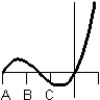 b:
b: 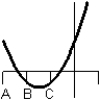 c:
c: 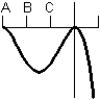 d:
d: 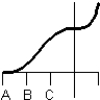 e:
e: 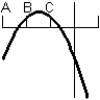 f:
f: 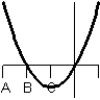
(Multiple Choice)
4.9/5 (28)
The acceleration of a race car during the first 35 seconds of a road test is modeled by 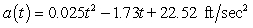 where t is the number of seconds since the test began. Assume the velocity and distance were both zero at the beginning of the road test. Calculate, to the nearest foot, the distance traveled during the first 35 seconds of the road test.
(Multiple Choice)
4.8/5 (35)
Consider the graph of r(t), the rate of change in the price of a technology stock, during the first 55 days of trading of 2003. Using the information present below, label each region as representing positive or negative change in price. 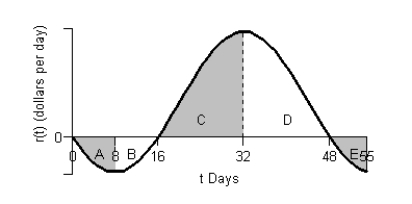

(Multiple Choice)
4.8/5 (27)
Filters
- Essay(0)
- Multiple Choice(0)
- Short Answer(0)
- True False(0)
- Matching(0)