Exam 5: Accumulating Change: Limits of Sums and the Definite Integral
Exam 1: Ingredients of Change: Functions an Limits50 Questions
Exam 2: Describing Change: Rates47 Questions
Exam 3: Determining Change: Derivatives48 Questions
Exam 4: Analyzing Change: Applications of Derivatives50 Questions
Exam 5: Accumulating Change: Limits of Sums and the Definite Integral50 Questions
Exam 6: Analyzing Accumulated Change: Integrals in Action51 Questions
Exam 7: Ingredients of Multivariable Change: Models, Graphs, Rates46 Questions
Exam 8: Analyzing Multivariable Change: Optimization50 Questions
Select questions type
A table of selected values for a function is given. Also shown are tables of values for the derivative and the accumulation function with 0 as the starting point. Determine which table contains the values of the derivative,  , and which contains the values of the accumulation function,
  . Justify your choice.
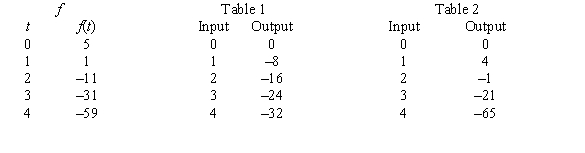
(Multiple Choice)
4.9/5  (33)
(33)
Consider the graph of f(t). 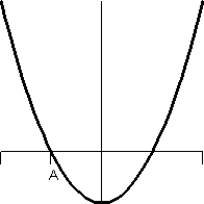 What does the graph of the accumulation function
  look like?
(Multiple Choice)
4.8/5 (31)
Suppose U.S. factory sales of electronic goods to dealers from 1990 through 2001 can be modeled by the equation Sales  billion dollars
Where x is the number of years since 1990. Use a definite integral to approximate, to four decimal places, the average value of U.S. factory sales of electronic goods to dealers from 1990 through 2001.
billion dollars
Where x is the number of years since 1990. Use a definite integral to approximate, to four decimal places, the average value of U.S. factory sales of electronic goods to dealers from 1990 through 2001.
(Multiple Choice)
4.8/5 (35)
Suppose the rate of change of the percentage of low-birthweight babies (less than 5 pounds 8 ounces) in 2000 can be modeled by 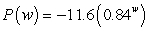 percentage points per pound when the mother gains w pounds during pregnancy. The model is valid for the weights between 18 and 43 pounds. Estimate, to two decimal places, the area of the region between the graph of P and the w-axis from
  to
to  using 5 midpoint rectangles. Interpret your answer.
(Multiple Choice)
4.9/5 (31)
Between 1956 and 2000, the rate of change of the winning times for the 100-meter butterfly at a world-class swimming competition can be described by  seconds per year, where t is the number of years since 1900. Find, to four decimal places, the average rate of change of the winning times for the competition from 1956 through 2000.
(Multiple Choice)
4.9/5 (34)
Suppose the graph shows the energy usage in megawatts for one day for a large university campus. The daily energy consumption for the campus is measured in megawatt-hours and is found by calculating the area of the region between the graph and the horizontal axis. Estimate, to the nearest 10 megawatt-hours, the daily energy consumption using eight right rectangles. 
(Multiple Choice)
4.9/5 (40)
Market revenue for Hammer Inc. (in millions of dollars per year) can be modeled by 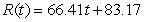 , where
  represents 1990. Evaluate
(Multiple Choice)
4.8/5 (31)
Suppose the population of a country between 1921 and 2000 is given by the model Population  million people
Where t is the number of years since the end of 1900. In what year was the population of the country equal to its 1990s average?
million people
Where t is the number of years since the end of 1900. In what year was the population of the country equal to its 1990s average?
(Multiple Choice)
4.8/5 (38)
Suppose the graph shows the energy usage in megawatts for one day for a large university campus. The daily energy consumption for the campus is measured in megawatt-hours and is found by calculating the area of the region between the graph and the horizontal axis. Estimate, to the nearest 10 megawatt-hours, the daily energy consumption using four left rectangles. 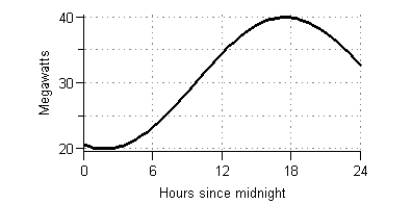
(Multiple Choice)
4.8/5 (35)
Suppose the rate of change of the per capita consumption of cottage cheese in the United States between 1980 and 1999 can be modeled by the function 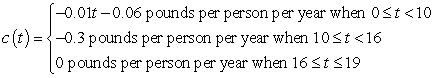 where t is the number of years since 1980. Find the area of the region between the graph and the horizontal axis between
  and
and  . Round your answer to three decimal places.
(Multiple Choice)
4.9/5 (31)
Suppose the population of a country between 1921 and 2000 is given by the model Population 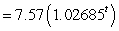 million people
Where t is the number of years since the end of 1900. What was the average rate of change of the population of the country during the 1990s? Round your answer to three decimal places.
million people
Where t is the number of years since the end of 1900. What was the average rate of change of the population of the country during the 1990s? Round your answer to three decimal places.
(Multiple Choice)
4.7/5 (33)
Suppose the number of general aviation aircraft accidents from 1975 through 1997 can be modeled by 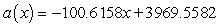 accidents where x is the number of years since 1975. Calculate, to the nearest integer, the average rate of change in the yearly number of accidents from 1977 through 1994.
(Multiple Choice)
4.8/5 (42)
Given the graph of f(t) 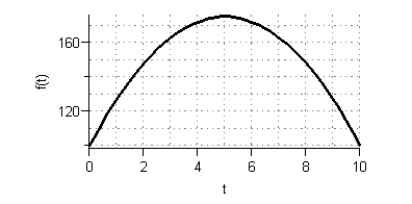 Sketch a graph of the accumulation function using four seconds as the starting point.
(Multiple Choice)
4.7/5 (38)
Consider the graph of the function: 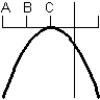 Identify, from the graphs a through f, the derivative graph and the accumulation graph (with point A as the starting point). a:
 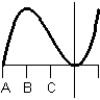 b:
b: 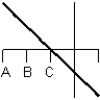 c:
c: 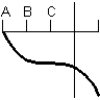 d:
d: 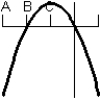 e:
e: 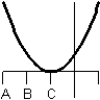 f:
f: 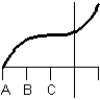
(Multiple Choice)
4.9/5 (28)
In the 1860s and 1870s Nevada experienced a mining boom. Suppose population of a boom town can be modeled by the function  where t is the number of years since 1860. What was the average population of the boom town between 1871 and 1881?
(Multiple Choice)
4.9/5 (46)
Suppose the number of general aviation aircraft accidents from 1975 through 1997 can be modeled by  accidents where x is the number of years since 1975. Use a definite integral to estimate, to the nearest accident, the number of accidents that occurred each year from 1978 through 1994.
(Multiple Choice)
4.8/5 (38)
A table of selected values for a function is given. Also shown are tables of values for the derivative and the accumulation function with 0 as the starting point. Determine which table contains the values of the derivative,  , and which contains the values of the accumulation function,
  . Justify your choice.
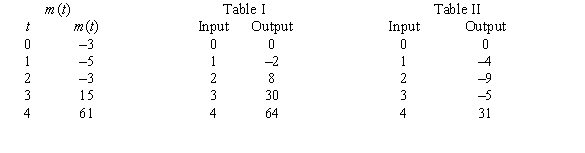
(Multiple Choice)
4.8/5 (25)
Filters
- Essay(0)
- Multiple Choice(0)
- Short Answer(0)
- True False(0)
- Matching(0)