Exam 11: Time Series Forecasting
Exam 1: Introduction to Modeling and Decision Analysis78 Questions
Exam 2: Introduction to Optimization and Linear Programming76 Questions
Exam 3: Modeling and Solving Lp Problems in a Spreadsheet93 Questions
Exam 4: Sensitivity Analysis and the Simplex Method76 Questions
Exam 5: Network Modeling92 Questions
Exam 6: Integer Linear Programming102 Questions
Exam 7: Goal Programming and Multiple Objective Optimization81 Questions
Exam 8: Nonlinear Programming Evolutionary Optimization87 Questions
Exam 9: Regression Analysis93 Questions
Exam 10: Data Mining125 Questions
Exam 11: Time Series Forecasting125 Questions
Exam 12: Introduction to Simulation Using Analytic Solver Platform85 Questions
Exam 13: Queuing Theory97 Questions
Exam 14: Decision Analysis125 Questions
Exam 15: Project Management Online82 Questions
Select questions type
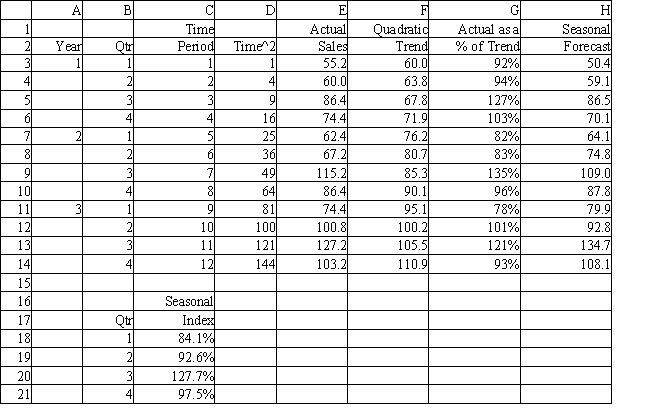
Exhibit 11.18
The following questions use the data below.
A store wants to predict quarterly sales. The owner has collected 3 years of sales data and wants your help in analyzing the data using the multiplicative seasonal method. 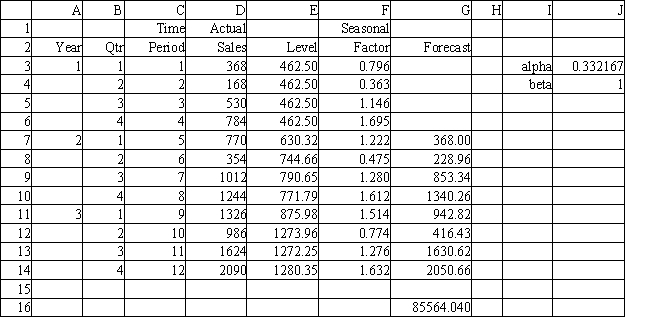 -Refer to Exhibit 11.18. What is the forecast for time period 13?
(Essay)
4.8/5  (47)
(47)
A technique that analyzes past behavior of a time-series variable to predict the future is referred to as
(Multiple Choice)
4.9/5 (37)
Exhibit 11.23
The following questions use the data below.
A store wants to predict quarterly sales. The owner has collected 3 years of sales data and wants your help in analyzing the data. He wants to use a quadratic trend model to forecast sales. 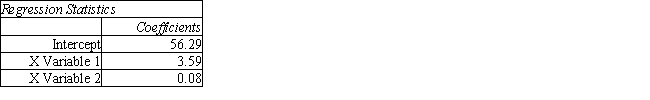
 -Refer to Exhibit 11.23. What is the forecast for time period 13?
(Essay)
4.9/5 (29)
Exhibit 11.5
The following questions use the data below.
A store wants to predict quarterly sales. The owner has collected 3 years of sales data and wants your help in analyzing the data using the multiplicative seasonal effects model.  -Refer to Exhibit 11.5. What formula should be entered in cell E3 to compute the base level when using the multiplicative seasonal effects method?
(Multiple Choice)
4.9/5 (34)
Exhibit 11.10
The following questions use the data below.
Joe's Sporting Goods wants to forecast quarterly sales figures using a quadratic trend model. The store has collected 12 quarters of data and needs your help to analyze the data. The relevant regression output is in the following table. 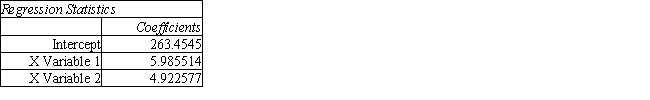
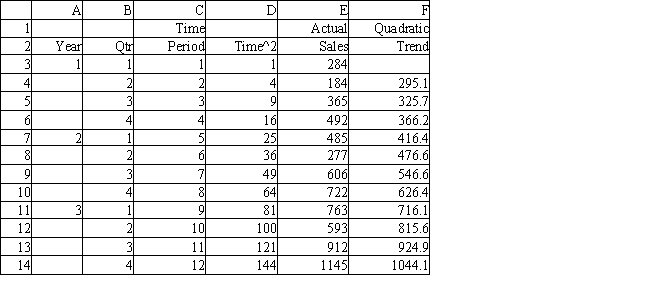 -Refer to Exhibit 11.10. What are predicted sales for the fourth quarter of year 4?
(Multiple Choice)
4.8/5 (33)
Exhibit 11.1
The following questions use the data below.
Honest Al's Used Cars wants to predict how many cars are sold each month. He has collected data for 12 months. He needs your help in analyzing this data using moving averages. 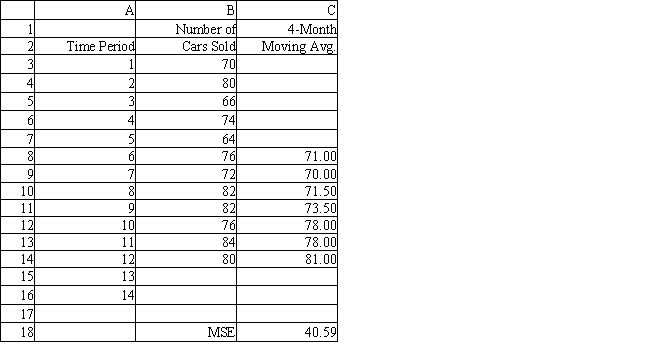 -Refer to Exhibit 11.1. What formula should be entered in cell C13 to compute the 4-month moving average forecast for month 11?
(Multiple Choice)
4.8/5 (32)
The determination of the MSE-minimizing value of the wi is a non-linear optimization problem because
(Multiple Choice)
4.7/5 (28)
A time series is a set of observations on a quantitative variable collected over time.
(True/False)
4.7/5 (39)
Exhibit 11.25
The following questions use the data below.
A store wants to predict quarterly sales. The owner has collected 3 years of sales data and wants your help in analyzing the data. He wants to use a seasonal regression model to forecast sales. 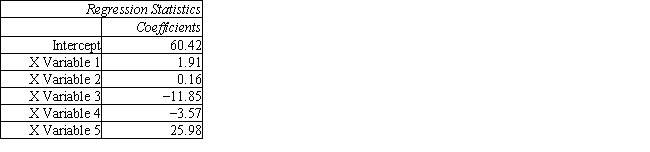
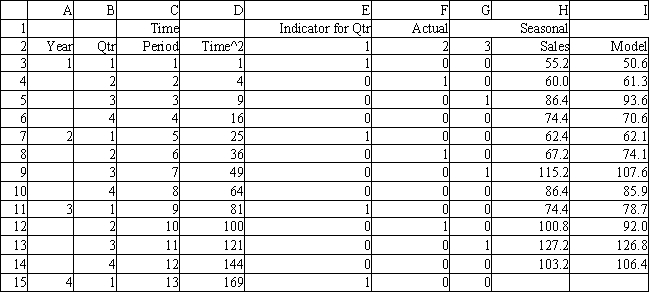 -Refer to Exhibit 11.25. What is the forecast for time period 13?
(Essay)
4.7/5 (37)
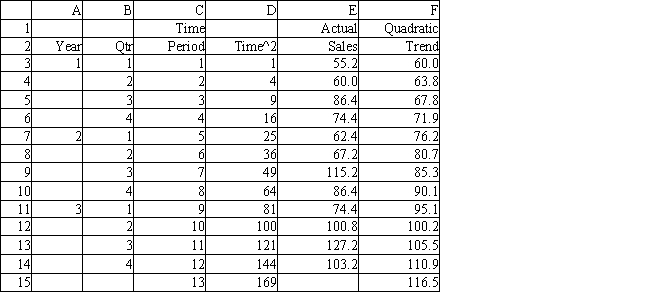
Exhibit 11.24
The following questions use the data below.
A store wants to predict quarterly sales. The owners have has collected 3 years of sales data and wants your help in analyzing the data. They want to use a quadratic trend model with seasonality to forecast sales. 
 -Refer to Exhibit 11.24. What is the forecast for time period 13?
(Essay)
4.9/5 (41)
Exhibit 11.8
The following questions use the data below.
Joe's Sporting Goods wants to forecast quarterly sales figures using Winter's method. The store has collected 12 quarters of data and needs your help to analyze the data. 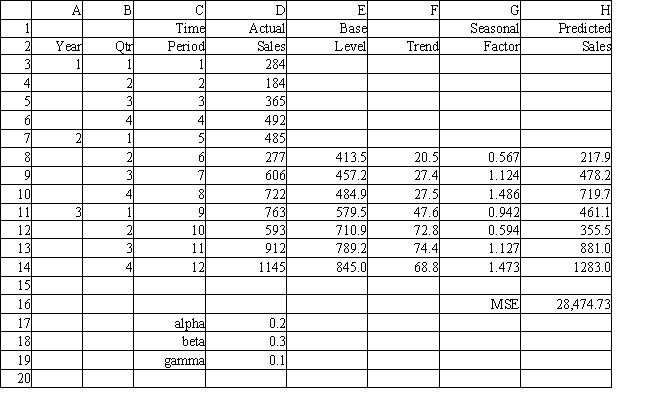 -Refer to Exhibit 11.8. What formula should be entered in cell G3 to compute the seasonal factor for year 1 Quarter 1?
(Multiple Choice)
4.7/5 (33)
Solver can be used to estimate model parameters when the time series is stationary and additive seasonal effects are present.
(True/False)
4.8/5 (38)
Exhibit 11.4
The following questions use the data below.
Joe's Sporting Goods wants to forecast quarterly sales figures using the additive seasonal method. The store has collected 12 quarters of data and needs your help to analyze the data.  -Refer to Exhibit 11.4. What formula should be entered in cell G12 to compute the forecast for time period 10?
(Multiple Choice)
4.8/5 (39)
Exhibit 11.5
The following questions use the data below.
A store wants to predict quarterly sales. The owner has collected 3 years of sales data and wants your help in analyzing the data using the multiplicative seasonal effects model.  -Refer to Exhibit 11.5. What formula should be entered in cell E7 to compute the remaining expected levels?
(Multiple Choice)
4.9/5 (38)
Exhibit 11.3
The following questions use the data below.
Honest Al's Used Cars wants to predict how many cars are sold each month. He has collected data for 12 months. He needs your help in analyzing this data using exponential smoothing. 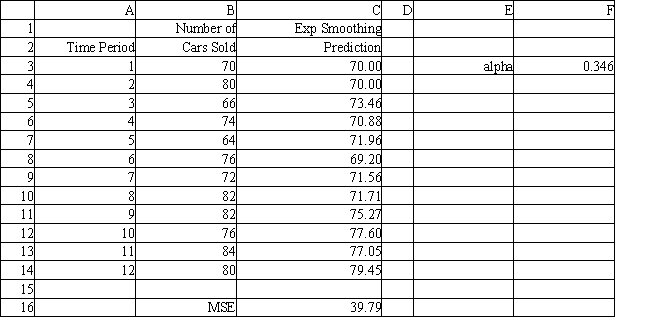 -Refer to Exhibit 11.3. What is the exponential smoothing forecast for month 13?
(Multiple Choice)
4.8/5 (39)
Exhibit 11.5
The following questions use the data below.
A store wants to predict quarterly sales. The owner has collected 3 years of sales data and wants your help in analyzing the data using the multiplicative seasonal effects model.  -Refer to Exhibit 11.5. What are predicted sales for time period 13 using the data in the spreadsheet?
(Multiple Choice)
4.8/5 (39)
A time series which has a significant upward or downward trend is referred to as
(Multiple Choice)
4.9/5 (36)
Exhibit 11.20
The following questions use the data below.
A store wants to predict quarterly sales. The owner has collected 3 years of sales data and wants your help in analyzing the data using Holt's method. 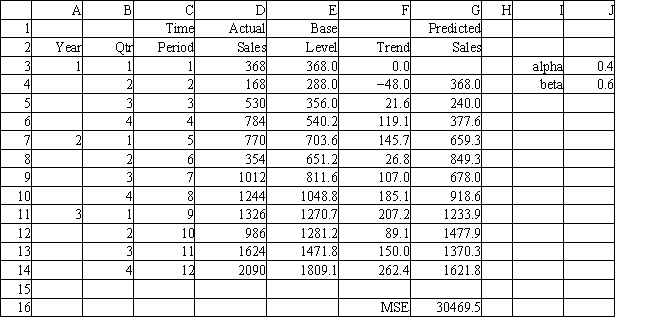 -Refer to Exhibit 11.20. The store wishes to use Solver to find the optimal values for cell E3. Provide the following Analytic Solver Platform (ASP) settings.
Objective Cell:
Variables Cells:
Constraints Cells:
-Refer to Exhibit 11.20. The store wishes to use Solver to find the optimal values for cell E3. Provide the following Analytic Solver Platform (ASP) settings.
Objective Cell:
Variables Cells:
Constraints Cells:
(Essay)
4.8/5 (30)
Filters
- Essay(0)
- Multiple Choice(0)
- Short Answer(0)
- True False(0)
- Matching(0)