Exam 11: Time Series Forecasting
Exam 1: Introduction to Modeling and Decision Analysis78 Questions
Exam 2: Introduction to Optimization and Linear Programming76 Questions
Exam 3: Modeling and Solving Lp Problems in a Spreadsheet93 Questions
Exam 4: Sensitivity Analysis and the Simplex Method76 Questions
Exam 5: Network Modeling92 Questions
Exam 6: Integer Linear Programming102 Questions
Exam 7: Goal Programming and Multiple Objective Optimization81 Questions
Exam 8: Nonlinear Programming Evolutionary Optimization87 Questions
Exam 9: Regression Analysis93 Questions
Exam 10: Data Mining125 Questions
Exam 11: Time Series Forecasting125 Questions
Exam 12: Introduction to Simulation Using Analytic Solver Platform85 Questions
Exam 13: Queuing Theory97 Questions
Exam 14: Decision Analysis125 Questions
Exam 15: Project Management Online82 Questions
Select questions type
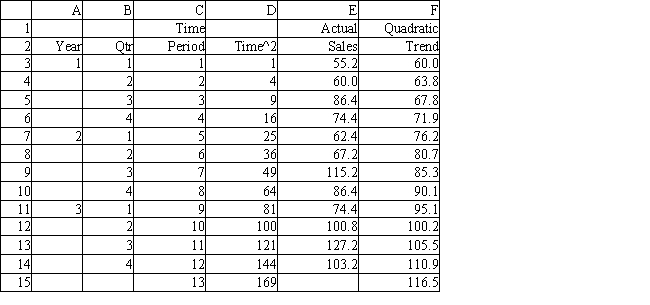
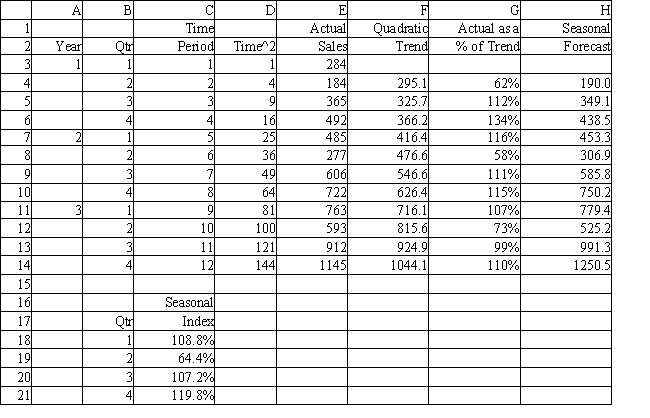
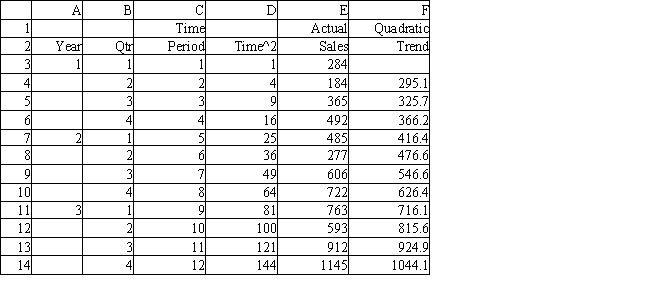
Exhibit 11.24
The following questions use the data below.
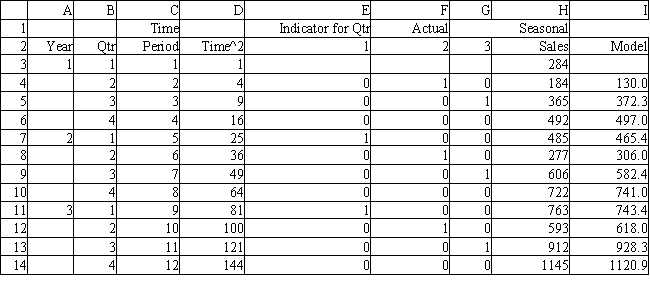
A store wants to predict quarterly sales. The owners have has collected 3 years of sales data and wants your help in analyzing the data. They want to use a quadratic trend model with seasonality to forecast sales. 
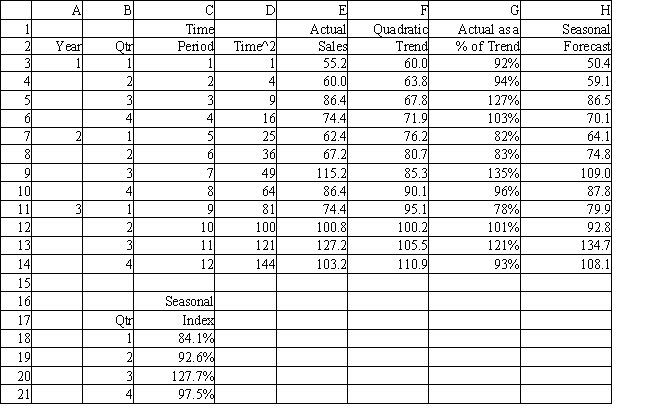 -Refer to Exhibit 11.24. Based on the regression output, what formulas should go in cells D3:H21?
(Essay)
4.7/5  (43)
(43)
Exhibit 11.1
The following questions use the data below.
Honest Al's Used Cars wants to predict how many cars are sold each month. He has collected data for 12 months. He needs your help in analyzing this data using moving averages. 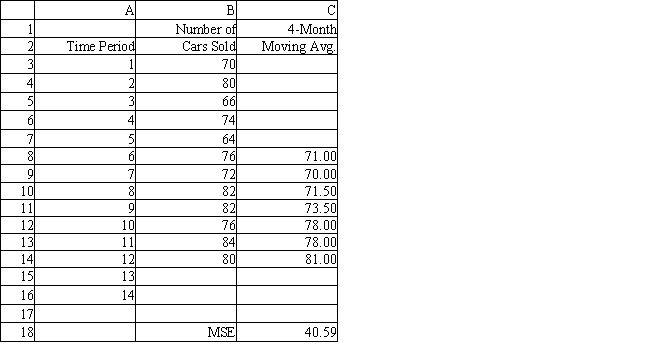 -Refer to Exhibit 11.1. What Excel function will compute the root mean squared error in cell C18 of the spreadsheet?
(Multiple Choice)
4.8/5 (43)
Which of the following statements are true regarding the difference between forecasts using exponential smoothing and forecasts using a weighted moving average method?
(Multiple Choice)
4.9/5 (39)
Why might we not be able to build a regression model to predict a dependent variable?
(Multiple Choice)
4.8/5 (43)
Exhibit 11.4
The following questions use the data below.
Joe's Sporting Goods wants to forecast quarterly sales figures using the additive seasonal method. The store has collected 12 quarters of data and needs your help to analyze the data. 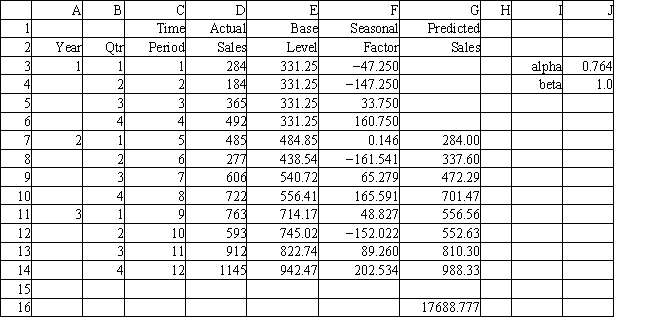 -Refer to Exhibit 11.4. What formula should be entered in cell E3 to compute the base level when using the additive seasonal effects method?
(Multiple Choice)
4.9/5 (43)
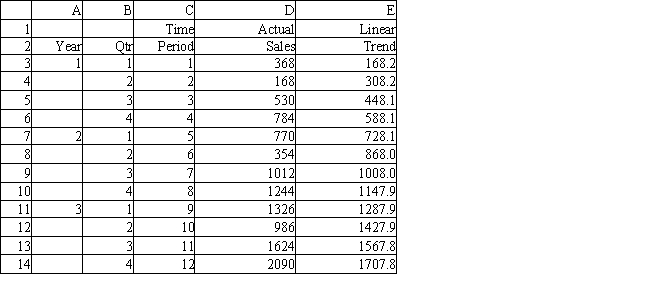
Exhibit 11.23
The following questions use the data below.
A store wants to predict quarterly sales. The owner has collected 3 years of sales data and wants your help in analyzing the data. He wants to use a quadratic trend model to forecast sales. 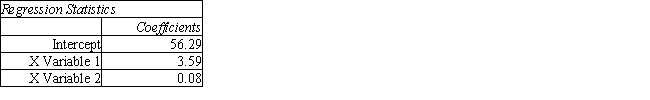
 -Refer to Exhibit 11.23. Based on the regression output, what formulas should go in cells D3:F14?
(Essay)
4.8/5 (29)
In stationary time series there is no significant upward or downward trend in the data over time.
(True/False)
4.8/5 (31)
Why might a forecaster calculate MSE values on just the most recent data in the time-series data set?
(Multiple Choice)
4.9/5 (37)
Exhibit 11.9
The following questions use the data below.
Joe's Sporting Goods wants to forecast quarterly sales figures using a linear trend model. The store has collected 12 quarters of data and needs your help to analyze the data. The relevant regression output is in the following table. 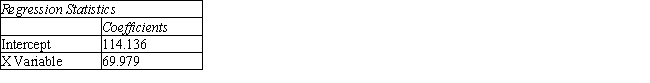
 -Refer to Exhibit 11.9. What are predicted sales for the fourth quarter of year 4?
(Multiple Choice)
4.9/5 (38)
Exhibit 11.12
The following questions use the data below.
Joe's Sporting Goods wants to forecast quarterly sales figures using a seasonal regression model. The store has collected 12 quarters of data and needs your help to analyze the data. The relevant regression output is provided in the following table. 
 -Refer to Exhibit 11.12. What is the Input X Range in the Regression command settings dialog box?
(Multiple Choice)
4.7/5 (38)
Exhibit 11.2
The following questions use the data below.
Honest Al's Used Cars wants to predict how many cars are sold each month. He has collected data for 12 months. He needs your help in analyzing this data using weighted moving averages. 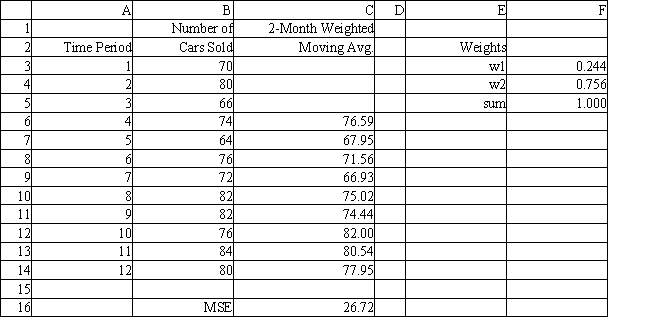 -Refer to Exhibit 11.2. What formula should be entered in cell C6 to compute the 2-month weighted moving average forecast for month 3?
(Multiple Choice)
4.9/5 (34)
Exhibit 11.4
The following questions use the data below.
Joe's Sporting Goods wants to forecast quarterly sales figures using the additive seasonal method. The store has collected 12 quarters of data and needs your help to analyze the data.  -Refer to Exhibit 11.4. What are predicted sales for time period 13 using the data in the spreadsheet?
(Multiple Choice)
4.9/5 (38)
Exhibit 11.3
The following questions use the data below.
Honest Al's Used Cars wants to predict how many cars are sold each month. He has collected data for 12 months. He needs your help in analyzing this data using exponential smoothing. 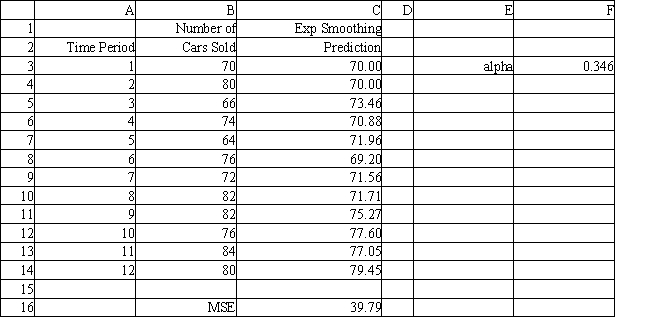 -Refer to Exhibit 11.3. Assume the forecasted value for month 13 is 79.64. What is the forecasted value for month 16?
(Multiple Choice)
4.9/5 (33)
Exhibit 11.7
The following questions use the data below.
Joe's Sporting Goods wants to forecast quarterly sales figures using Holt's method. The store has collected 12 quarters of data and needs your help to analyze the data. 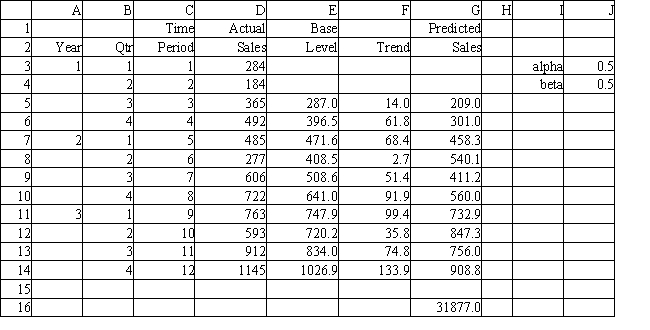 -Refer to Exhibit 11.7. What formula should be entered in cell E4 to compute the base level when using Holt's method?
(Multiple Choice)
4.9/5 (37)
Exhibit 11.12
The following questions use the data below.
Joe's Sporting Goods wants to forecast quarterly sales figures using a seasonal regression model. The store has collected 12 quarters of data and needs your help to analyze the data. The relevant regression output is provided in the following table. 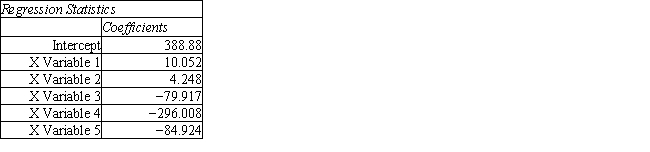
 -Refer to Exhibit 11.12. What formula should be entered in cell I3 to compute the Seasonal Value for year 1 Quarter 1?
(Multiple Choice)
4.8/5 (36)
Exhibit 11.11
The following questions use the data below.
Joe's Sporting Goods wants to forecast quarterly sales figures using seasonal indices. The store has collected 12 quarters of data and needs your help to analyze the data. The relevant regression output is in the following table. 
 -Refer to Exhibit 11.11. What are predicted sales for the first quarter of year 4?
(Multiple Choice)
4.9/5 (41)
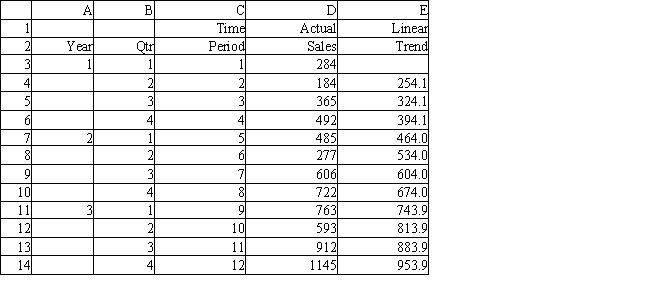
Exhibit 11.22
The following questions use the data below.
A store wants to predict quarterly sales. The owner has collected 3 years of sales data and wants your help in analyzing the data. He wants to use regression and a linear trend model. 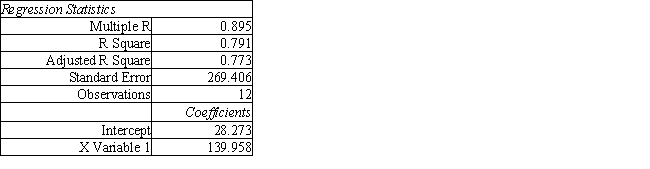
 -Refer to Exhibit 11.22. Based on the regression output, what formulas should go in cells E3:E14?
(Essay)
4.8/5 (39)
The correct formula for the weighted moving average extrapolation technique with different weights is
(Multiple Choice)
4.9/5 (39)
Exhibit 11.10
The following questions use the data below.
Joe's Sporting Goods wants to forecast quarterly sales figures using a quadratic trend model. The store has collected 12 quarters of data and needs your help to analyze the data. The relevant regression output is in the following table. 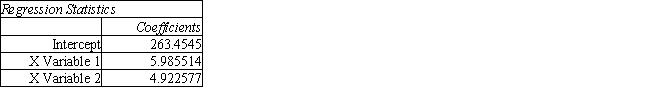
 -Refer to Exhibit 11.10. What is the Input Y Range in the Regression command settings dialog box?
(Multiple Choice)
4.8/5 (46)
Filters
- Essay(0)
- Multiple Choice(0)
- Short Answer(0)
- True False(0)
- Matching(0)