Exam 4: Describing Data: Displaying and Exploring Data
Exam 1: What Is Statistics79 Questions
Exam 2: Describing Data: Frequency Tables, Frequency Distributions, and Graphic Presentation129 Questions
Exam 3: Describing Data: Numerical Measures117 Questions
Exam 4: Describing Data: Displaying and Exploring Data92 Questions
Exam 5: A Survey of Probability Concepts121 Questions
Exam 6: Discrete Probability Distributions114 Questions
Exam 7: Continuous Probability Distributions100 Questions
Exam 8: Sampling Methods and the Central Limit Theorem114 Questions
Exam 9: Estimation and Confidence Intervals114 Questions
Exam 10: One-Sample Tests of Hypothesis129 Questions
Exam 11: Two-Sample Tests of Hypothesis122 Questions
Exam 12: Analysis of Variance92 Questions
Exam 13: Correlation and Linear Regression130 Questions
Exam 14: Multiple Regression Analysis122 Questions
Exam 15: Nonparametric Methods: Goodness-Of-Fit Tests128 Questions
Select questions type
A relationship between two nominal variables is summarized by a contingency table.
(True/False)
4.8/5  (24)
(24)
Given the sample information in the following table regarding public opinion on gun control, who is more likely to favor gun control? 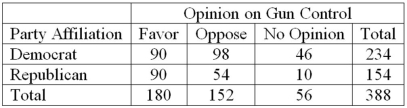
(Essay)
4.9/5 (38)
A telemarketing firm is monitoring the performance of its employees based on the number of sales per hour. One employee had the following sales for the last 19 hours. 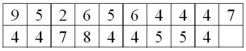 What is the first quartile for the distribution of number of sales per hour?
(Short Answer)
4.9/5 (36)
The coefficient of skewness is the standard deviation divided by the mean.
(True/False)
4.9/5 (34)
In a distribution, the second quartile corresponds with the __________.
(Multiple Choice)
4.8/5 (40)
For the following data, are any of the observations an outlier? 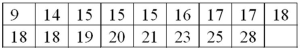
(Short Answer)
4.9/5 (28)
If a distribution is negatively skewed, the distribution is not symmetrical and the long tail is to the left.
(True/False)
4.9/5 (35)
The ______________ is used to measure the relative symmetry of a distribution.
(Short Answer)
4.7/5 (30)
A student scored in the 85th percentile on a standardized test. This means that the student scored lower than 85% of all students who took the test.
(True/False)
4.8/5 (36)
In a positively skewed distribution, the 50th percentile is the same as the ______________.
(Short Answer)
4.8/5 (38)
A sample of experienced typists revealed that their mean typing speed is 87 words per minute and the median typing speed is 73 words per minute. The standard deviation of typing speed is 16.9 words per minute. What is the Pearson coefficient of skewness?
(Multiple Choice)
4.7/5 (29)
Filters
- Essay(0)
- Multiple Choice(0)
- Short Answer(0)
- True False(0)
- Matching(0)