Exam 4: Describing Data: Displaying and Exploring Data
Exam 1: What Is Statistics79 Questions
Exam 2: Describing Data: Frequency Tables, Frequency Distributions, and Graphic Presentation129 Questions
Exam 3: Describing Data: Numerical Measures117 Questions
Exam 4: Describing Data: Displaying and Exploring Data92 Questions
Exam 5: A Survey of Probability Concepts121 Questions
Exam 6: Discrete Probability Distributions114 Questions
Exam 7: Continuous Probability Distributions100 Questions
Exam 8: Sampling Methods and the Central Limit Theorem114 Questions
Exam 9: Estimation and Confidence Intervals114 Questions
Exam 10: One-Sample Tests of Hypothesis129 Questions
Exam 11: Two-Sample Tests of Hypothesis122 Questions
Exam 12: Analysis of Variance92 Questions
Exam 13: Correlation and Linear Regression130 Questions
Exam 14: Multiple Regression Analysis122 Questions
Exam 15: Nonparametric Methods: Goodness-Of-Fit Tests128 Questions
Select questions type
If the coefficient of skewness is equal to zero, the shape of the distribution is __________.
(Multiple Choice)
4.7/5  (34)
(34)
For the following data, find the information required to construct a box plot. 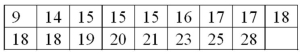
(Essay)
4.8/5 (28)
A scatter diagram of sales versus production is labeled with sales on the Y-axis and production on the X-axis.
(True/False)
4.8/5 (38)
The test scores for a class of 147 students are computed. What is the location of the test score associated with the third quartile?
(Multiple Choice)
4.8/5 (35)
A telemarketing firm is monitoring the performance of its employees based on the number of sales per hour. One employee had the following sales for the last 19 hours. 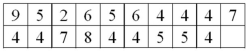 What is the third quartile for the distribution of number of sales per hour?
(Short Answer)
4.8/5 (35)
A scatter diagram is used to illustrate a relationship between gender and the preference for Coke or Pepsi.
(True/False)
4.8/5 (31)
If the mean of a distribution is smaller than the median and mode, the sign of Pearson's coefficient of skewness is ______________.
(Short Answer)
4.8/5 (46)
In a scatter diagram, we describe the relationship between __________.
(Multiple Choice)
4.8/5 (26)
What is the difference between a scatter diagram and a contingency table?
(Essay)
4.8/5 (35)
What is the possible range of values for Pearson's coefficient of skewness?
(Multiple Choice)
4.8/5 (27)
A telemarketing firm is monitoring the performance of its employees based on the number of sales per hour. One employee had the following sales for the last 19 hours. 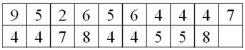 What is the median for the distribution of number of sales per hour?
(Short Answer)
4.8/5 (38)
A sample of the homes currently offered for sale revealed that the mean asking price is $75,900, the median $70,100, and the modal price is $67,200. The standard deviation of the distribution is $5,900. What is Pearson's coefficient of skewness in this sample?
(Short Answer)
4.8/5 (38)
Given the sample information in the following table regarding public opinion on gun control, what percent of Democrats have no opinion? 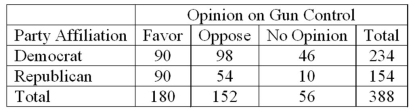
(Essay)
4.9/5 (33)
Filters
- Essay(0)
- Multiple Choice(0)
- Short Answer(0)
- True False(0)
- Matching(0)