Exam 4: Describing Data: Displaying and Exploring Data
Exam 1: What Is Statistics79 Questions
Exam 2: Describing Data: Frequency Tables, Frequency Distributions, and Graphic Presentation129 Questions
Exam 3: Describing Data: Numerical Measures117 Questions
Exam 4: Describing Data: Displaying and Exploring Data92 Questions
Exam 5: A Survey of Probability Concepts121 Questions
Exam 6: Discrete Probability Distributions114 Questions
Exam 7: Continuous Probability Distributions100 Questions
Exam 8: Sampling Methods and the Central Limit Theorem114 Questions
Exam 9: Estimation and Confidence Intervals114 Questions
Exam 10: One-Sample Tests of Hypothesis129 Questions
Exam 11: Two-Sample Tests of Hypothesis122 Questions
Exam 12: Analysis of Variance92 Questions
Exam 13: Correlation and Linear Regression130 Questions
Exam 14: Multiple Regression Analysis122 Questions
Exam 15: Nonparametric Methods: Goodness-Of-Fit Tests128 Questions
Select questions type
A telemarketing firm is monitoring the performance of its employees based on the number of sales per hour. One employee had the following sales for the last 19 hours. 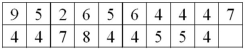 For the distribution of number of sales per hour, what is the interquartile range?
(Short Answer)
4.8/5  (37)
(37)
The research director of a large oil company studied the buying habits of consumers with respect to the amount of gasoline purchased at full-service pumps. The sample mean amount is 11.5 gallons and the median amount is 11.95 gallons. The standard deviation of the sample is 4.5 gallons. What is Pearson's coefficient of skewness here?
(Short Answer)
4.8/5 (38)
A dot plot is useful for quickly graphing frequencies in a small data set.
(True/False)
4.9/5 (27)
For the following data, how many observations are in the data? 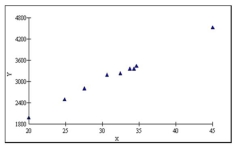
(Short Answer)
4.9/5 (25)
A telemarketing firm is monitoring the performance of its employees based on the number of sales per hour. One employee had the following sales for the last 20 hours. Draw a dot plot for the data. 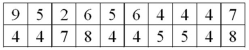
(Essay)
4.8/5 (25)
In a symmetric distribution, is the 99th percentile is located in the ________ tail.
(Short Answer)
4.9/5 (35)
Pearson's coefficient of skewness (Sk) ranges from -3.0 to +3.0. It is computed by subtracting the median from the mean, multiplying the result by 3, and dividing by the _______________.
(Short Answer)
4.8/5 (39)
Pearson's coefficient of skewness is a measure of a distribution's symmetry.
(True/False)
4.9/5 (40)
A telemarketing firm is monitoring the performance of its employees based on the number of sales per hour. One employee had the following sales for the last 19 hours. 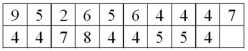 For the distribution of number of sales per hour, 50% are equal or greater than ___________.
(Short Answer)
4.9/5 (31)
A scatter diagram of sales versus production may be constructed by plotting the minimum, first quartile, median, third quartile, and the maximum values of each variable.
(True/False)
4.8/5 (44)
A ___________ is the best way to display the relationship between two variables measured on an interval or ratio level.
(Short Answer)
4.7/5 (30)
Filters
- Essay(0)
- Multiple Choice(0)
- Short Answer(0)
- True False(0)
- Matching(0)