Exam 35: The Short-Run Trade-Off Between Inflation and Unemployment
Exam 1: Ten Principles of Economics439 Questions
Exam 2: Thinking Like an Economist617 Questions
Exam 3: Interdependence and the Gains From Trade527 Questions
Exam 4: The Market Forces of Supply and Demand697 Questions
Exam 5: Elasticity and Its Application594 Questions
Exam 6: Supply, Demand, and Government Policies645 Questions
Exam 7: Consumers, Producers, and the Efficiency of Markets549 Questions
Exam 8: Application: the Costs of Taxation513 Questions
Exam 9: Application: International Trade492 Questions
Exam 10: Externalities524 Questions
Exam 11: Public Goods and Common Resources433 Questions
Exam 12: The Design of the Tax System549 Questions
Exam 13: The Costs of Production420 Questions
Exam 14: Firms in Competitive Markets543 Questions
Exam 15: Monopoly637 Questions
Exam 16: Monopolistic Competition580 Questions
Exam 17: Oligopoly488 Questions
Exam 18: The Markets for the Factors of Production564 Questions
Exam 19: Earnings and Discrimination490 Questions
Exam 20: Income Inequality and Poverty455 Questions
Exam 21: The Theory of Consumer Choice431 Questions
Exam 22: Frontiers of Microeconomics440 Questions
Exam 23: Measuring a Nations Income520 Questions
Exam 24: Measuring the Cost of Living529 Questions
Exam 25: Production and Growth505 Questions
Exam 26: Saving, Investment, and the Financial System564 Questions
Exam 27: The Basic Tools of Finance500 Questions
Exam 28: Unemployment678 Questions
Exam 29: The Monetary System515 Questions
Exam 30: Money Growth and Inflation481 Questions
Exam 31: Open-Economy Macroeconomics: Basic Concepts522 Questions
Exam 32: A Macroeconomic Theory of the Open Economy475 Questions
Exam 33: Aggregate Demand and Aggregate Supply562 Questions
Exam 34: The Influence of Monetary and Fiscal Policy on Aggregate Demand508 Questions
Exam 35: The Short-Run Trade-Off Between Inflation and Unemployment491 Questions
Exam 36: Six Debates Over Macroeconomic Policy372 Questions
Select questions type
Which of the following would reduce the natural rate of unemployment?
(Multiple Choice)
4.8/5  (39)
(39)
If the central bank increases the money supply, then in the short run prices
(Multiple Choice)
4.8/5 (34)
The "natural" rate of unemployment is the unemployment rate toward which the economy gravitates in the
(Multiple Choice)
4.8/5 (36)
In the long run, if the Fed decreases the growth rate of the money supply,
(Multiple Choice)
5.0/5 (31)
Which of the following is not associated with an adverse supply shock?
(Multiple Choice)
4.9/5 (38)
If the central bank increases the money supply, in the short run, the price level
(Multiple Choice)
4.8/5 (33)
If the minimum wage increased, then at any given rate of inflation
(Multiple Choice)
5.0/5 (40)
Does a more steeply sloped Phillips curve make the sacrifice ratio smaller or larger than otherwise?
(Essay)
4.8/5 (39)
If a central bank decreases the money supply in response to an adverse supply shock, then which of the following quantities moves closer to its pre-shock value as a result?
(Multiple Choice)
4.8/5 (39)
Explain the connection between the vertical long-run aggregate supply curve and the vertical long-run Phillips curve.
(Essay)
4.9/5 (33)
If people eventually adjust their inflation expectations so that in the long run actual and expected inflation are the same, then policymakers
(Multiple Choice)
4.8/5 (39)
According to Friedman and Phelps's analysis of the Phillips curve,
(Multiple Choice)
4.9/5 (41)
In 1979, Fed chair Paul Volcker decided to pursue a policy
(Multiple Choice)
4.9/5 (28)
Samuelson and Solow reasoned that when aggregate demand was high, unemployment was
(Multiple Choice)
4.9/5 (35)
The restrictive monetary policy followed by the Fed in the early 1980s
(Multiple Choice)
4.7/5 (38)
Figure 35-2
Use the pair of diagrams below to answer the following questions. 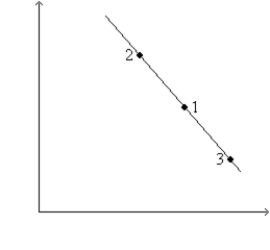
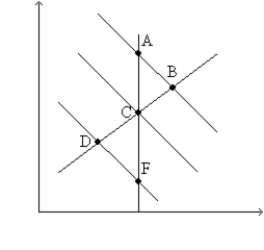 -Refer to Figure 35-2. If the economy starts at C and 1, then in the short run, a decrease in the money supply moves the economy to
(Multiple Choice)
4.8/5 (38)
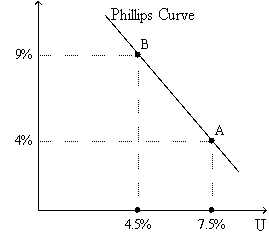
Figure 35-3. The left-hand graph shows a short-run aggregate-supply (SRAS) curve and two aggregate-demand (AD) curves. On the left-hand diagram, Y represents output and on the right-hand diagram, U represents the unemployment rate. 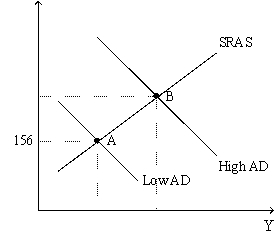
 -Refer to Figure 35-3. Assume the figure depicts possible outcomes for the year 2018. In 2018, the economy is at point A on the left-hand graph, which corresponds to point A on the right-hand graph. The price level in the year 2017 was
(Multiple Choice)
4.8/5 (33)
Figure 35-8
Use this graph to answer the questions below.  -Refer to figure 35-8. Suppose the economy starts at 5% unemployment and 3% inflation and expected inflation remains at 3%. Which one of the following points could the economy move to in the short run if the Federal Reserve pursues a more expansionary monetary policy?
(Multiple Choice)
4.8/5 (39)
Filters
- Essay(0)
- Multiple Choice(0)
- Short Answer(0)
- True False(0)
- Matching(0)