Exam 35: The Short-Run Trade-Off Between Inflation and Unemployment
Exam 1: Ten Principles of Economics439 Questions
Exam 2: Thinking Like an Economist617 Questions
Exam 3: Interdependence and the Gains From Trade527 Questions
Exam 4: The Market Forces of Supply and Demand697 Questions
Exam 5: Elasticity and Its Application594 Questions
Exam 6: Supply, Demand, and Government Policies645 Questions
Exam 7: Consumers, Producers, and the Efficiency of Markets549 Questions
Exam 8: Application: the Costs of Taxation513 Questions
Exam 9: Application: International Trade492 Questions
Exam 10: Externalities524 Questions
Exam 11: Public Goods and Common Resources433 Questions
Exam 12: The Design of the Tax System549 Questions
Exam 13: The Costs of Production420 Questions
Exam 14: Firms in Competitive Markets543 Questions
Exam 15: Monopoly637 Questions
Exam 16: Monopolistic Competition580 Questions
Exam 17: Oligopoly488 Questions
Exam 18: The Markets for the Factors of Production564 Questions
Exam 19: Earnings and Discrimination490 Questions
Exam 20: Income Inequality and Poverty455 Questions
Exam 21: The Theory of Consumer Choice431 Questions
Exam 22: Frontiers of Microeconomics440 Questions
Exam 23: Measuring a Nations Income520 Questions
Exam 24: Measuring the Cost of Living529 Questions
Exam 25: Production and Growth505 Questions
Exam 26: Saving, Investment, and the Financial System564 Questions
Exam 27: The Basic Tools of Finance500 Questions
Exam 28: Unemployment678 Questions
Exam 29: The Monetary System515 Questions
Exam 30: Money Growth and Inflation481 Questions
Exam 31: Open-Economy Macroeconomics: Basic Concepts522 Questions
Exam 32: A Macroeconomic Theory of the Open Economy475 Questions
Exam 33: Aggregate Demand and Aggregate Supply562 Questions
Exam 34: The Influence of Monetary and Fiscal Policy on Aggregate Demand508 Questions
Exam 35: The Short-Run Trade-Off Between Inflation and Unemployment491 Questions
Exam 36: Six Debates Over Macroeconomic Policy372 Questions
Select questions type
Which of the following implies that an increase in the money supply growth rate permanently changes the unemployment rate?
(Multiple Choice)
4.9/5  (44)
(44)
Figure 35-6
Use the graph below to answer the following questions. 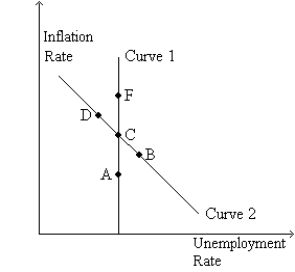 -Refer to Figure 35-6. If the economy starts at C and the money supply growth rate increases, in the long run the economy
(Multiple Choice)
4.9/5 (42)
Figure 35-1. The left-hand graph shows a short-run aggregate-supply (SRAS) curve and two aggregate-demand (AD) curves. On the right-hand diagram, U represents the unemployment rate. 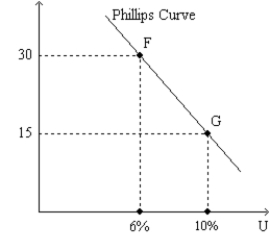
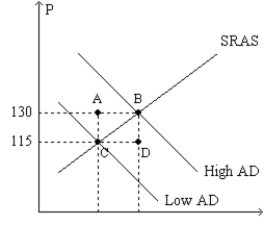 -Refer to Figure 35-1. What is measured along the vertical axis of the right-hand graph?
(Multiple Choice)
5.0/5 (43)
If more firms chose to pay efficiency wages, which of the following would shift to the right?
(Multiple Choice)
4.8/5 (42)
If the central bank decreases the money supply, then in the short run prices
(Multiple Choice)
4.8/5 (29)
Which of the following would not be associated with a favorable supply shock?
(Multiple Choice)
4.7/5 (35)
Economist A.W. Phillips found a negative correlation between
(Multiple Choice)
4.9/5 (39)
A given short-run Phillips curve shows that an increase in the inflation rate will be accompanied by a lower unemployment rate in the short run.
(True/False)
4.8/5 (46)
The proliferation of Internet usage serves as an example of a favorable supply shock.
(True/False)
4.7/5 (29)
A movement to the right along a given short-run Phillips curve could be caused by
(Multiple Choice)
4.8/5 (39)
As an economist working for a U.S. government agency you determine that a particular country has a sacrifice ratio of 3. Policy-makers in that country are thinking of lowering the inflation rate from 10% to 4%. Is this sacrifice ratio higher or lower than the typical estimate? From your numbers, what is the amount of output that will be lost for this country to reduce its inflation rate?
(Multiple Choice)
4.9/5 (37)
Data for the United States traced out an almost perfect Phillips curve for much of the
(Multiple Choice)
4.9/5 (39)
A central bank announces it will decrease the inflation rate by 10 percentage points. People are skeptical of the announcement, but do expect the central bank will reduce inflation by 5 percentage points and so expected inflation falls by 5 percentage points. If the central bank decreases inflation by only 3 percentage points then the unemployment rate will fall.
(True/False)
4.8/5 (45)
Figure 35-4. The left-hand graph shows a short-run aggregate-supply (SRAS) curve and two aggregate-demand (AD) curves. On the left-hand diagram, the price level is measured on the vertical axis; on the right-hand diagram, the inflation rate is measured on the vertical axis. 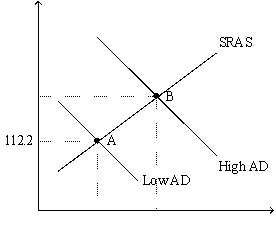
 -Refer to Figure 35-4. What is measured along the horizontal axis of the right-hand graph?
(Multiple Choice)
4.8/5 (28)
Figure 35-4. The left-hand graph shows a short-run aggregate-supply (SRAS) curve and two aggregate-demand (AD) curves. On the left-hand diagram, the price level is measured on the vertical axis; on the right-hand diagram, the inflation rate is measured on the vertical axis.
-Refer to Figure 35-4. What is measured along the horizontal axis of the left-hand graph?
(Multiple Choice)
4.7/5 (32)
Which of the following would we not expect if government policy moved the economy up along a given short-run Phillips curve?
(Multiple Choice)
4.8/5 (37)
Filters
- Essay(0)
- Multiple Choice(0)
- Short Answer(0)
- True False(0)
- Matching(0)