Exam 14: Statistical Methods for Quality Control
Exam 1: Data and Statistics84 Questions
Exam 2: Descriptive Statistics: Tabular and Graphical Presentations116 Questions
Exam 3: Descriptive Statistics: Numerical Measures130 Questions
Exam 4: Introduction to Probability127 Questions
Exam 5: Discrete Probability Distributions146 Questions
Exam 6: Continuous Probability Distributions138 Questions
Exam 7: Sampling and Sampling Distributions123 Questions
Exam 8: Interval Estimation111 Questions
Exam 9: Hypothesis Tests117 Questions
Exam 10: Comparisons Involving Means, Experimental Design, and Analysis of Variance184 Questions
Exam 11: Comparisons Involving Proportions and a Test of Independence117 Questions
Exam 12: Simple Linear Regression107 Questions
Exam 13: Multiple Regression111 Questions
Exam 14: Statistical Methods for Quality Control72 Questions
Exam 15: Time Series Analysis and Forecastng75 Questions
Select questions type
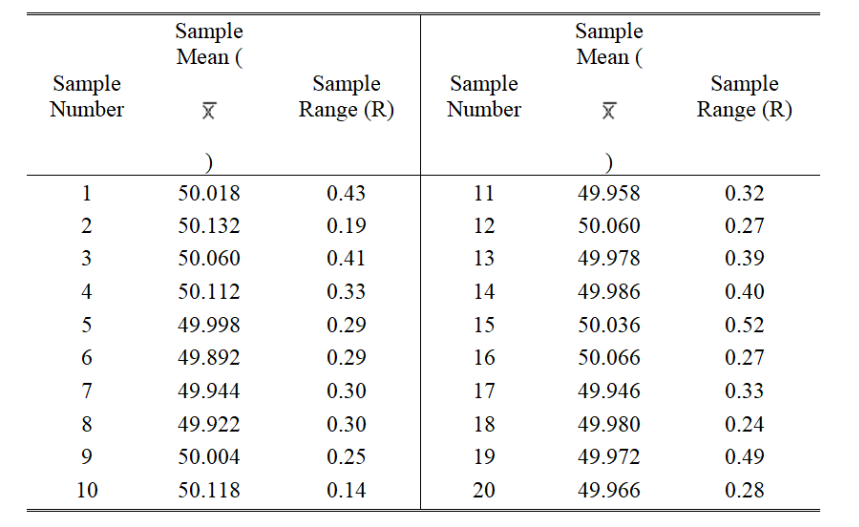
Harry Coates wants to construct  and R charts at the bag-filling operation for Meow Chow cat food. He knows that when the filling operation is functioning correctly, bags of cat food should average 50.00 pounds and 5-bag samples should have an average range of .330 pounds.
Harry had twenty 5-bag samples taken at 2-hour intervals and the sample means and ranges are shown below. Determine the center lines and upper and lower control limits for the
and R charts at the bag-filling operation for Meow Chow cat food. He knows that when the filling operation is functioning correctly, bags of cat food should average 50.00 pounds and 5-bag samples should have an average range of .330 pounds.
Harry had twenty 5-bag samples taken at 2-hour intervals and the sample means and ranges are shown below. Determine the center lines and upper and lower control limits for the  and R charts.
(Essay)
4.7/5  (37)
(37)
Variation in the quality of production output that is due to factors such as machine tools wearing out is called
(Multiple Choice)
4.9/5 (34)
A group of items such as incoming shipments of raw material is called
(Multiple Choice)
4.9/5 (34)
When a Motorola executive said "That evaluation is …. perhaps the most cost-effective, value-added business consultation available anywhere in the world today" he was referring to
(Multiple Choice)
4.9/5 (27)
A control chart that is used to monitor the range of the measurements in a sample is
(Multiple Choice)
4.9/5 (36)
Snipper, Inc. manufactures lawnmowers that require minor, final assembly by the customer. A sealed plastic bag containing the hardware (nuts, bolts, washers, and so on) needed for final assembly is included with each lawnmower shipped. During a week of normal, in-control operation, twenty samples of 200 bags of hardware were examined for content (hardware type and count) accuracy. A total of 104 bags of the 4000 examined failed to have the correct contents.
a. Compute the upper limit, center line, and lower limit for a p chart.
b. Compute the upper limit, center line, and lower limit for an np chart.
(Essay)
4.9/5 (20)
In practice, it is common to use the sample _____ to estimate the process _________.
(Multiple Choice)
4.8/5 (30)
Heavy emphasis on statistical analysis and careful measurement are closely associated with
(Multiple Choice)
4.8/5 (35)
A graphical tool used to help determine whether a process is in control or out of control is a
(Multiple Choice)
4.8/5 (37)
The following data represent the filling weights based on samples of 14.5 ounce cans of whole peeled tomatoes. Ten samples of size 5 were taken. Use Excel to develop an x-bar chart.

(Essay)
4.9/5 (32)
The two general classifications of attributes in quality control are
(Multiple Choice)
4.8/5 (33)
The upper and lower control limits of a process are 66 and 54. Samples of size 16 are used for the inspection process. Determine the mean and the standard deviation for this process.
(Short Answer)
4.9/5 (38)
The following data represent the filling weights based on samples of 14.5 ounce cans of whole peeled tomatoes. Ten samples of size 5 were taken. Use Excel to develop an R chart.

(Essay)
4.9/5 (42)
An operating characteristic curve is based on a ________ probability distribution.
(Multiple Choice)
4.8/5 (39)
__________ consist(s) of making a series of inspections and measurements to determine whether quality standards are being met.
(Multiple Choice)
4.7/5 (39)
A U.S. manufacturer of digital video recorders purchases a circuit board from a Taiwanese firm. The circuit boards are shipped in lots of 2000. The acceptance sampling procedure uses 12 randomly selected circuit boards. The acceptance number is 1. If p0 is .03 and p1 is .20, what are the producer's and consumer's risks for this plan?
(Essay)
4.9/5 (36)
Control charts based on data that can be measured on a continuous scale are called
(Multiple Choice)
4.8/5 (41)
To inspect incoming shipments of components, a manufacturer is considering samples of sizes 12, 15, and 18. Use binomial probabilities to select a sampling plan that provides a producer's risk of = .12 when p0 is .04 and a consumer's risk of = .08 when p1 is .25.
(Short Answer)
4.9/5 (40)
Brakes Shop, Inc., is a franchise that specializes in repairing brake systems of automobiles. The company purchases brake shoes from a national supplier. Currently, lots of 1,000 brake shoes are purchased, and each shoe is inspected before being installed on an automobile. The company has decided, instead of 100% inspection, to adopt an acceptance sampling plan.
a.Explain what is meant by the acceptance sampling plan.
b.If the company decides to adopt an acceptance sampling plan, what kinds of risks are there?
c.The quality control department of the company has decided to select a sample of 10 shoes and inspect them for defects. Furthermore, it has been decided that if the sample contains no defective parts, the entire lot will be accepted. If there are 50 defective shoes in a shipment, what is the probability that the entire lot will be accepted?
d.What is the probability of accepting the lot if there are 100 defective units in the lot?
(Essay)
4.9/5 (42)
Filters
- Essay(0)
- Multiple Choice(0)
- Short Answer(0)
- True False(0)
- Matching(0)