Exam 14: Statistical Methods for Quality Control
Exam 1: Data and Statistics84 Questions
Exam 2: Descriptive Statistics: Tabular and Graphical Presentations116 Questions
Exam 3: Descriptive Statistics: Numerical Measures130 Questions
Exam 4: Introduction to Probability127 Questions
Exam 5: Discrete Probability Distributions146 Questions
Exam 6: Continuous Probability Distributions138 Questions
Exam 7: Sampling and Sampling Distributions123 Questions
Exam 8: Interval Estimation111 Questions
Exam 9: Hypothesis Tests117 Questions
Exam 10: Comparisons Involving Means, Experimental Design, and Analysis of Variance184 Questions
Exam 11: Comparisons Involving Proportions and a Test of Independence117 Questions
Exam 12: Simple Linear Regression107 Questions
Exam 13: Multiple Regression111 Questions
Exam 14: Statistical Methods for Quality Control72 Questions
Exam 15: Time Series Analysis and Forecastng75 Questions
Select questions type
A control chart used when the output of a process is measured in terms of the mean value of a variable such as a length, weight, temperature, and so on is
(Multiple Choice)
4.7/5  (34)
(34)
Normal or natural variation in the quality of production output that is due purely to chance is called
(Multiple Choice)
4.8/5 (30)
We can examine the effect of the sampling plan on both types of risks by varying the assumed
(Multiple Choice)
4.8/5 (33)
The No-Cal Bottling Company bottles soft drinks for sale to government commissaries. The bottles come in only one flavor (chocolate-lemon) and only one size (32 ounces). Joan Stickler, the quality control officer for the commissaries, wants to keep track of the fill weights of No-Cal and begins to draw daily samples of 100 bottles from the daily receipts. The first ten sample means and ranges are:
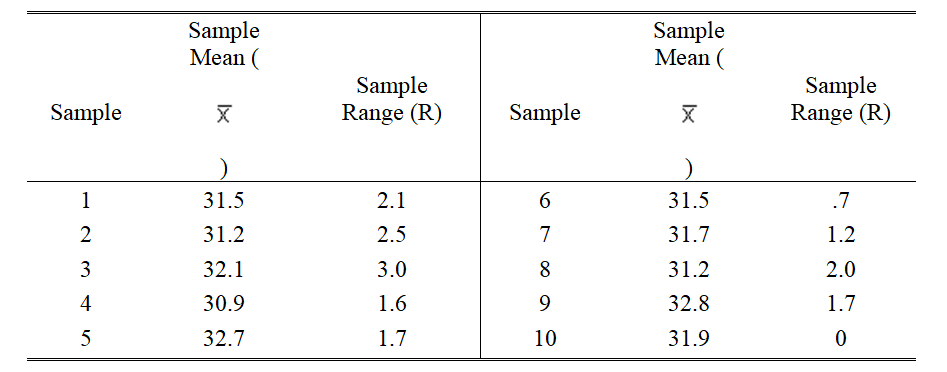 If sample ranges ordinarily average 2.5 ounces:
a. Compute 3s control limits for sample means.
b. Compute 3s control limits for sample ranges.
c. What would you conclude about the fill weights of NoCal?
If sample ranges ordinarily average 2.5 ounces:
a. Compute 3s control limits for sample means.
b. Compute 3s control limits for sample ranges.
c. What would you conclude about the fill weights of NoCal?
(Essay)
4.9/5 (35)
The following data represent the filling weights based on samples of 350-gram containers. Ten samples of size 5 were taken. Use Excel to develop an x-bar chart.

(Essay)
4.8/5 (39)
A process that is in control has a mean of = 56.5 and a standard deviation of = 3.4. What should the control limits be for a sample mean chart if samples of size 8 are taken?
(Short Answer)
4.9/5 (37)
The control limits for an x-bar chart are how many standard deviations above and below the process mean?
(Multiple Choice)
4.7/5 (39)
A form of acceptance sampling in which more than one sample or stage is used is called a
(Multiple Choice)
5.0/5 (40)
A production process is considered in control if 4% of the items produced are defective. Samples of size 100 are used for the inspection process.
a.Determine the standard error of the proportion.
b.Determine the upper and the lower control limits for the p chart.
(Essay)
4.9/5 (31)
The weight of bags of cement filled by Granite Rock Company's packaging process is normally distributed with a mean of 50 pounds and a standard deviation of 1.5 pounds when the process is in control. What should the control limits be for a sample mean,  , chart if 9 bags are sampled at a time?
(Essay)
4.8/5 (36)
The control limits for a p chart are how many standard deviations above and below the proportion defective?
(Multiple Choice)
5.0/5 (33)
A control chart that is used when the output of a production process is measured in terms of the proportion defective is
(Multiple Choice)
4.9/5 (24)
A process sampled 30 times with a sample of size nine resulted in  = 12.7 and
  = 0.8. Compute the upper and lower control limits for the
  and
and  charts for this process.
(Essay)
4.9/5 (31)
An acceptance sampling plan with n = 20 and c = 1 has been designed with a producer's risk of .12.
a. Was the value of p0 equal to .02, .03, .04, or .05?
b. What is the consumer's risk associated with this plan if p1 is .08?
c. Assume the consumer's risk found in (b) is unacceptably high. Which modification of the sampling plan will result in the greater reduction of the consumer's risk, increasing n to 30 or decreasing c to 0?
(Essay)
4.7/5 (22)
A control chart that is used to monitor the number of defectives in a sample is
(Multiple Choice)
4.7/5 (35)
Which of the following is a statistical method used in quality control?
(Multiple Choice)
4.8/5 (36)
In contrast to Deming's philosophy, which required a major cultural change in the organization, Juran's programs were designed to improve quality by
(Multiple Choice)
4.8/5 (38)
The second stage of a two-stage acceptance sampling plan is executed when the first-stage result is
(Multiple Choice)
4.9/5 (34)
Filters
- Essay(0)
- Multiple Choice(0)
- Short Answer(0)
- True False(0)
- Matching(0)