Exam 5: Cost Behavior and Cost-Volume-Profit Analysis
Exam 1: Managerial Accounting Concepts and Principles251 Questions
Exam 2: Job Order Costing and Analysis216 Questions
Exam 3: Process Costing and Analysis231 Questions
Exam 4: Activity-Based Costing and Analysis223 Questions
Exam 5: Cost Behavior and Cost-Volume-Profit Analysis248 Questions
Exam 6: Variable Costing and Analysis202 Questions
Exam 7: Master Budgets and Performance Planning215 Questions
Exam 8: Flexible Budgets and Standard Costs221 Questions
Exam 9: Performance Measurement and Responsibility Accounting210 Questions
Exam 10: Relevant Costing for Managerial Decisions145 Questions
Exam 11: Capital Budgeting and Investment Analysis157 Questions
Exam 12: Reporting Cash Flows240 Questions
Exam 13: Analysis of Financial Statements235 Questions
Exam 14: Time Value of Money83 Questions
Exam 15: Lean Principles and Accounting27 Questions
Exam 16: Accounting for Business Transactions251 Questions
Select questions type
Assume that sales are predicted to be $3,750, the expected contribution margin is $1,500, and a net loss of $250 is anticipated. The break-even point in sales dollars is:
Free
(Multiple Choice)
4.9/5  (36)
(36)
Correct Answer: Verified
E
The variable costing method is required for external financial reporting.
Free
(True/False)
4.8/5 (33)
Correct Answer:Verified
False
Cost-volume-profit analysis can be used to compute expected income from predicted sales and cost levels.
Free
(True/False)
4.9/5 (40)
Correct Answer:Verified
True
________ is a statistical method of identifying an estimated line of cost behavior.
(Short Answer)
5.0/5 (37)
A firm provides the following sales data:
Expected unit sales………… 5,000 Unit variable cost………… $10
Unit selling price…………… $16 Total fixed cost…………… $12,000
Required:
(a) Calculate the break-even point in dollar sales.
(b) Calculate the margin of safety in dollar sales.
(Essay)
4.9/5 (46)
The relevant range of operations includes extremely high and low levels of production that are unlikely to occur.
(True/False)
4.8/5 (41)
Managers can use variable costing information for internal decision making, but they must use absorption costing for external reporting purposes.
(True/False)
4.9/5 (41)
Varigon Co. produces and sells three products-Household, Commercial, and Industrial, and has total fixed costs of $52,000. Sales and cost data follow:
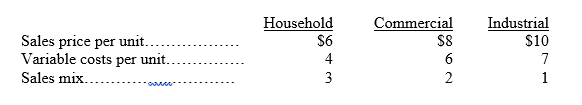 Calculate the break-even point in composite units.
(Essay)
4.7/5 (30)
Identify items a, b, and c in the cost-volume-profit graph shown below. 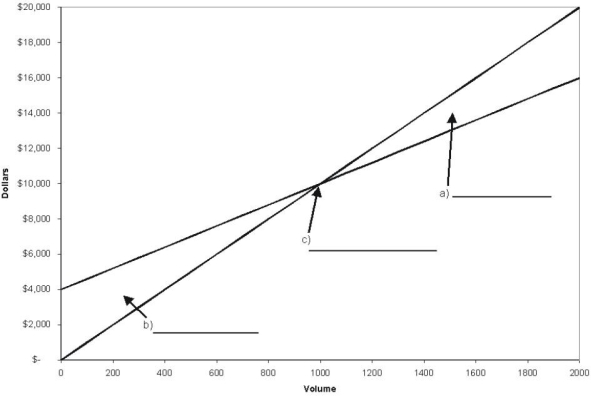
(Essay)
4.8/5 (33)
A graph used to analyze past cost behaviors by displaying costs and unit data for each period as points on a diagram is called a:
(Multiple Choice)
4.9/5 (33)
Use the following information to determine the break-even point in sales dollars:

(Multiple Choice)
4.7/5 (38)
Barclay Bikes manufactures and sells three distinct styles of bicycles: the Youth model sells for $300 and has a unit contribution margin of $105; the Adult model sells for $850 and has a unit contribution margin of $450; and the Recreational model sells for $1,000 and has a unit contribution margin of $500. The company's sales mix includes: 5 Youth models; 9 Adult models; and 6 Recreational models. If the firm's annual fixed costs total $6,500,000, calculate the firm's contribution margin ratio per composite unit (rounded to the nearest whole percentage).
(Multiple Choice)
4.7/5 (46)
A company sells a single product that has a contribution margin ratio of 28%. If the company's total fixed costs are $84,000, what is the break-even point in dollar sales?
(Essay)
4.8/5 (41)
What is operating leverage? How can the degree of operating leverage be used in analyzing changes in sales?
(Essay)
4.8/5 (28)
A cost that includes both fixed and variable cost components is called a:
(Multiple Choice)
4.8/5 (37)
The contribution margin ratio is the percent by which the margin of safety exceeds the break-even point.
(True/False)
4.8/5 (36)
The proportion of sales volumes for various products in a multiproduct company is known as the composite mix.
(True/False)
4.8/5 (46)
When using the high-low method for estimating cost behavior, the slope, or variable cost per unit, is calculated by ________.
(Short Answer)
4.9/5 (36)
Cost-volume-profit analysis is used to determine the number of units that must be sold to break even..
(True/False)
4.8/5 (45)
Filters
- Essay(0)
- Multiple Choice(0)
- Short Answer(0)
- True False(0)
- Matching(0)