Exam 4: Descriptive Statistics
Exam 1: Overview of Statistics50 Questions
Exam 2: Data Collection95 Questions
Exam 3: Describing Data Visually108 Questions
Exam 4: Descriptive Statistics134 Questions
Exam 5: Probability121 Questions
Exam 6: Discrete Probability Distributions127 Questions
Exam 7: Continuous Probability Distributions112 Questions
Exam 8: Sampling Distributions and Estimation99 Questions
Exam 9: One-Sample Hypothesis Tests136 Questions
Exam 10: Two-Sample Hypothesis Tests115 Questions
Exam 11: Analysis of Variance141 Questions
Exam 12: Simple Regression120 Questions
Exam 13: Multiple Regression111 Questions
Exam 14: Time-Series Analysis111 Questions
Exam 15: Chi-Square Tests94 Questions
Exam 16: Nonparametric Tests84 Questions
Exam 17: Quality Management103 Questions
Select questions type
Briefly describe these data.Sketch its box plot and describe the sample succinctly. 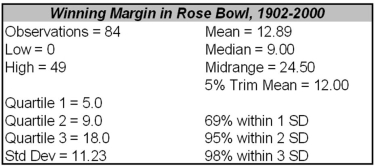
(Essay)
4.9/5  (35)
(35)
Which is a characteristic of the mean as a measure of center?
(Multiple Choice)
4.9/5 (33)
A certain health maintenance organization (HMO)examined the number of office visits by its members in the last year.This data set would probably be skewed to the left due to low outliers.
(True/False)
4.9/5 (32)
VenalCo Market Research surveyed 50 individuals who recently purchased a certain CD,revealing the age distribution shown below.Which statement is least defensible? 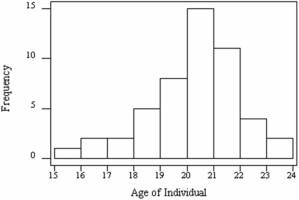
(Multiple Choice)
4.9/5 (39)
Chebyshev's Theorem says that at least 95 percent of the data lie within 2 standard deviations of the mean.
(True/False)
4.9/5 (35)
Ten randomly chosen students at a certain university were asked how many times they smoked marijuana during the preceding week.Their answers were 0,8,0,0,2,4,0,0,6,0.A campus newspaper article appeared,with the headline "Average Student Uses No Pot." Is this a fair assessment of central tendency? Discuss the alternatives.
(Essay)
4.9/5 (31)
Estimating the mean from grouped data will tend to be most accurate when:
(Multiple Choice)
4.7/5 (37)
Here are descriptive statistics from Excel for annual per-pupil expenditures in 94 Ohio cities and home sizes in a certain neighborhood.Very briefly compare the variability and shape of the two data sets. 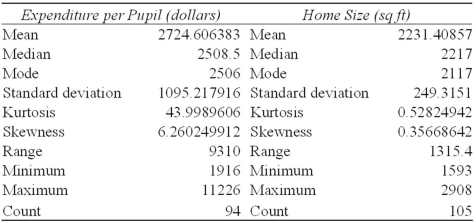
(Essay)
4.9/5 (33)
The ______________ shows the relationship between two variables.
(Multiple Choice)
4.9/5 (39)
The following frequency distribution shows the amount earned yesterday by employees of a large Las Vegas casino.Estimate the mean daily earnings. 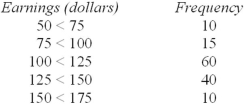
(Multiple Choice)
4.7/5 (38)
Which of the following statements is likely to apply to the incomes of 50 randomly chosen taxpayers in California?
(Multiple Choice)
4.9/5 (29)
A survey of 10 randomly chosen drivers showed the following number of persons per car including the driver: 1,5,1,5,2,1,1,1,2,1.Describe the center,variability,and skewness for this sample. 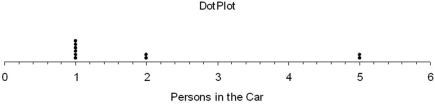
(Essay)
4.7/5 (34)
In the following data set {7,5,0,2,7,15,5,2,7,18,7,3,0},the value 7 is:
(Multiple Choice)
4.8/5 (43)
A positive kurtosis coefficient in Excel indicates a leptokurtic condition in a distribution.
(True/False)
4.7/5 (45)
Below are the ages of 21 CEOs.Find the mean,median,and mode.Are there any outliers? Explain.
46,48,49,49,50,52,54,55,57,57,58,59,60,61,62,62,63,63,65,67,75 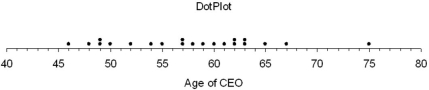
(Essay)
4.9/5 (34)
If Q1 = 150 and Q3 = 250,the upper fences (inner and outer)are:
(Multiple Choice)
4.9/5 (28)
In Osaka,Japan,stock brokers earn ¥6000 per hour on the average,with a standard deviation of ¥1200.In Stuttgart,Germany,stock brokers earn an average of €18 per hour with a standard deviation of €6.In which country is the variation in wages greatest?
(Essay)
4.8/5 (35)
Which of the following is not a valid description of an outlier?
(Multiple Choice)
4.9/5 (40)
Filters
- Essay(0)
- Multiple Choice(0)
- Short Answer(0)
- True False(0)
- Matching(0)