Exam 4: Descriptive Statistics
Exam 1: Overview of Statistics50 Questions
Exam 2: Data Collection95 Questions
Exam 3: Describing Data Visually108 Questions
Exam 4: Descriptive Statistics134 Questions
Exam 5: Probability121 Questions
Exam 6: Discrete Probability Distributions127 Questions
Exam 7: Continuous Probability Distributions112 Questions
Exam 8: Sampling Distributions and Estimation99 Questions
Exam 9: One-Sample Hypothesis Tests136 Questions
Exam 10: Two-Sample Hypothesis Tests115 Questions
Exam 11: Analysis of Variance141 Questions
Exam 12: Simple Regression120 Questions
Exam 13: Multiple Regression111 Questions
Exam 14: Time-Series Analysis111 Questions
Exam 15: Chi-Square Tests94 Questions
Exam 16: Nonparametric Tests84 Questions
Exam 17: Quality Management103 Questions
Select questions type
When a sample has an odd number of observations,the median is the:
(Multiple Choice)
4.7/5  (39)
(39)
Briefly describe this sample of departure delays on American Airlines flights out of Denver over a seven-day period,March 3-9 (n = 150 flights). 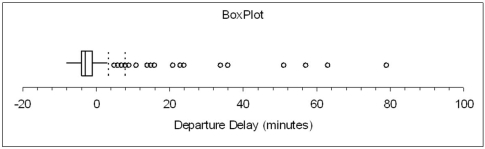
(Essay)
4.7/5 (31)
Find the coefficient of variation of these numbers: 14,17,17,19,26.Would the variability of those numbers be greater than,less than,or the same as the variability of 24,27,27,29,36? Defend your answer.
(Essay)
4.9/5 (39)
Twelve randomly chosen students were asked how many times they had missed class during a certain semester,with this result: 2,1,5,1,1,3,4,3,1,1,5,18.For this sample,the median is:
(Multiple Choice)
4.8/5 (38)
A leptokurtic distribution is more sharply peaked (i.e. ,thinner tails)than a normal distribution.
(True/False)
4.8/5 (35)
A 10-point quiz was given by Professor Ennuyeaux.Of the 10 students in the class,half got zero and the others got perfect scores.List the students' scores.Then find the mean,median,mode,and geometric mean of their scores.Which is the most appropriate measure of center? The least appropriate?
(Essay)
4.9/5 (39)
A sample consists of the following data: 7,11,12,18,20,22,43.Using the "three standard deviation" criterion,the last observation (X = 43)would be considered an outlier.
(True/False)
4.7/5 (38)
A trimmed mean may be preferable to a mean when a data set has extreme values.
(True/False)
4.9/5 (41)
Twelve randomly chosen students were asked how many times they had missed class during a certain semester,with this result: 3,2,1,2,1,5,9,1,2,3,3,10.The geometric mean is:
(Multiple Choice)
4.7/5 (29)
Three randomly chosen Michigan students were asked how many round trips they made to Canada last year.Their replies were 3,4,5.The geometric mean is:
(Multiple Choice)
4.8/5 (40)
Referring to this box plot of ice cream fat content,the skewness would be negative. 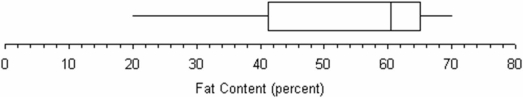
(True/False)
4.9/5 (37)
Twelve randomly chosen students were asked how many times they had missed class during a certain semester,with this result: 3,2,1,2,1,5,9,1,2,3,3,10.The median is:
(Multiple Choice)
4.7/5 (37)
Craig operates a part-time snow-plowing business using a 2002 GMC 2500 HD extended cab short box truck.Describe Craig's gasoline mileage based on this box plot of 195 tanks of gas. 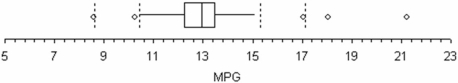
(Essay)
5.0/5 (36)
A data set with two values that are tied for the highest number of occurrences is called bimodal.
(True/False)
4.8/5 (35)
A certain health maintenance organization (HMO)examined the number of office visits by each of its members in the last year.For this data set,we would anticipate that the geometric mean would be
(Multiple Choice)
4.9/5 (44)
In a left-skewed distribution,we expect that the median will be greater than the mean.
(True/False)
4.9/5 (38)
The quartiles of a distribution are most clearly revealed in which display?
(Multiple Choice)
4.8/5 (37)
A national survey showed that most commuter cars contain only the driver.Hungry for a story,a campus newspaper reporter asked five randomly chosen commuter students how many occupants,including the driver,rode to school in their cars.Their responses were 1,1,1,1,and 6.The next day a story appeared in the paper headlined "University Commuters Double National Average Ridership." Is this a reasonable assessment of central tendency? How would you characterize the variability of the sample?
(Essay)
4.7/5 (36)
Find the sample correlation coefficient for the following data. 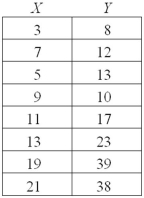
(Multiple Choice)
5.0/5 (33)
Exam scores in a small class were 10,10,20,20,40,60,80,80,90,100,100.For this data set,which statement is incorrect concerning measures of center?
(Multiple Choice)
4.9/5 (44)
Filters
- Essay(0)
- Multiple Choice(0)
- Short Answer(0)
- True False(0)
- Matching(0)