Exam 10: Managing Demand and Forecasting
Exam 1: Creating Customer Value Through Operations92 Questions
Exam 2: Supply Chain Management100 Questions
Exam 3: Process Configuration114 Questions
Exam 4: Capacity101 Questions
Exam 5: Inventory Management152 Questions
Exam 6: Quality and Process Improvement197 Questions
Exam 7: Lean Systems158 Questions
Exam 8: Managing Projects152 Questions
Exam 9: Location and Layout197 Questions
Exam 10: Managing Demand and Forecasting139 Questions
Exam 11: Operations Planning and Scheduling123 Questions
Exam 12: Resource Planning151 Questions
Exam 13: Waiting Lines93 Questions
Exam 14: Decision Making73 Questions
Exam 15: Financial Analysis41 Questions
Exam 16: Work Measurement97 Questions
Exam 17: Learning Curve Analysis44 Questions
Exam 18: Computer-Integrated Manufacturing53 Questions
Exam 19: Acceptance Sampling Plans71 Questions
Exam 20: Simulation36 Questions
Exam 21: Special Inventory Models32 Questions
Exam 22: Linear Programming47 Questions
Select questions type
Table 10.4
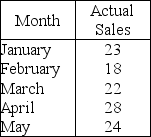 -Use the information in Table 10.4.What is the forecast for July with the two-month moving average method and June sales of 40 units?
(Multiple Choice)
4.9/5  (33)
(33)
Which one of the following statements about forecasting is FALSE?
(Multiple Choice)
4.8/5 (32)
Judgment methods of forecasting should never be used with quantitative forecasting methods.
(True/False)
4.8/5 (45)
Time-series analysis is a statistical approach that relies heavily on historical demand data to project the future size of demand.
(True/False)
4.7/5 (36)
A naive forecast is a time-series method whereby the forecast for the next period equals the demand for the current period.
(True/False)
4.9/5 (42)
The Delphi method is a process of gaining consensus from a group of experts while maintaining their anonymity.
(True/False)
4.9/5 (41)
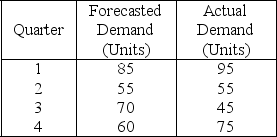
Table 10.7
 -Use the information in Table 10.7.The cumulative sum of errors CFE from months 2 through 5 is
(Multiple Choice)
4.8/5 (35)
A backlog is an accumulation of customer orders that a manufacturer has promised for delivery at some future date.
(True/False)
4.8/5 (37)
Table 10.8
A manager wants to forecast the monthly demand
for a machine the company produces.
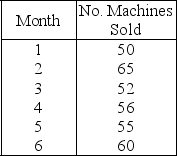 -Use the information in Table 10.8.Calculate the MAD for months 4 through 6 for the weighted moving average forecasts.The weights are 0.50,0.30,and 0.20,where 0.50 refers to the most recent demand.
(Multiple Choice)
4.8/5 (40)
A(n)________ is a customer order that cannot be filled immediately but is filled as soon as possible.
(Essay)
4.8/5 (41)
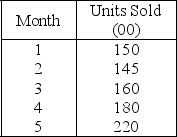
Table 10.9
 -Use the information in Table 10.9.What is the mean absolute deviation of forecast errors for the data?
(Multiple Choice)
4.9/5 (32)
________ is a causal method of forecasting in which one variable is related to one or more variables by a linear equation.
(Essay)
4.7/5 (30)
Table 10.4
-Use the information in Table 10.4.Suppose actual sales in June turn out to be 40 units.Use the three-month moving average method to forecast the sales in July.
(Multiple Choice)
4.8/5 (38)
An independent variable is the measure or quantity being forecast in linear regression analysis.
(True/False)
4.7/5 (35)
Which one of the following statements about forecasting is FALSE?
(Multiple Choice)
4.8/5 (38)
A(n)________ forecast is a time-series method whereby the forecast for the next period equals the demand for the current period.
(Essay)
4.8/5 (32)
Doctors,dentists,lawyers,and automobile repair shops are examples of service providers that use ________.
(Essay)
4.8/5 (42)
Table 10.4
-Use the information in Table 10.4.The forecasting equation for a three-month weighted moving average is: At = W1Dt + W2Dt - 1 + W3Dt - 2  =
= 
 +
+ 
 -1 +
-1 + 
 -2
If the sales for June were 40 units and the weights are W1= 1/2,W2 = 1/3,and W3 = 1/6,what is the forecast for July?
-2
If the sales for June were 40 units and the weights are W1= 1/2,W2 = 1/3,and W3 = 1/6,what is the forecast for July?
(Multiple Choice)
4.7/5 (35)
changes in the dependent variable must take place with sufficient lead time before the associated change in the independent variables,for causal model to be useful as a forecasting tool.
(True/False)
4.8/5 (43)
Table 10.3
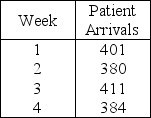 -Use the information in Table 10.3.If the actual number of patients is 415 in week 5,what is the forecast for week 6 using a three-week moving average forecast?
(Multiple Choice)
4.8/5 (43)
Filters
- Essay(0)
- Multiple Choice(0)
- Short Answer(0)
- True False(0)
- Matching(0)