Exam 1: Getting Started
Exam 1: Getting Started347 Questions
Exam 2: The U.S.and Global Economies211 Questions
Exam 3: The Economic Problem283 Questions
Exam 4: Demand and Supply334 Questions
Exam 5: Elasticities of Demand and Supply342 Questions
Exam 6: Efficiency and Fairness of Markets364 Questions
Exam 7: Government Actions in Markets248 Questions
Exam 8: Taxes270 Questions
Exam 9: Global Markets in Action281 Questions
Exam 10: Externalities301 Questions
Exam 11: Public Goods and Common Resources180 Questions
Exam 12: Markets with Private Information103 Questions
Exam 13: Consumer Choice and Demand295 Questions
Exam 14: Production and Cost274 Questions
Exam 15: Perfect Competition285 Questions
Exam 16: Monopoly384 Questions
Exam 17: Monopolistic Competition221 Questions
Exam 18: Oligopoly228 Questions
Exam 19: Markets for Factors of Production188 Questions
Exam 20: Economic Inequality164 Questions
Select questions type
Which of the following statements best describes the study of economics? Economics studies how
(Multiple Choice)
4.7/5  (30)
(30)
Rather than go out to eat by yourself,you decide to stay at home and fix dinner for yourself and your two roommates.Your roommates applaud your decision.Your roommates tell you that your decision to eat at home has no opportunity cost because you already have all the dinner ingredients in your pantry.Is this comment correct?
(Essay)
4.8/5 (28)
The opportunity cost of a one-unit increase in an activity
(Multiple Choice)
4.8/5 (27)
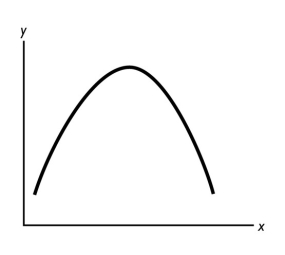 -In the figure above,the relationship between the x variable and the y variable
(Multiple Choice)
4.8/5 (40)
Different nations answer the what,how,and for whom questions differently.China,for instance,builds dams using many workers and only a little capital equipment.The United States builds dams using a few workers and a lot of capital equipment.Which economic question are these two nations answering and why do the answers differ?
(Essay)
4.7/5 (42)
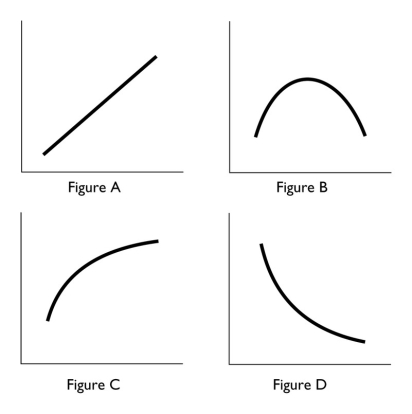 -In the above,which figure(s)show(s)a relationship between the variables that is always negative?
(Multiple Choice)
4.9/5 (32)
 -Graph the data in the table above in the figure.Label the axes.
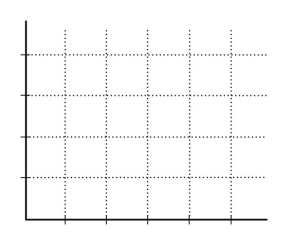 a.Is the relationship between X and Y positive or negative?
b.What is the slope when X = 4?
c.What is the slope when X = 8?
a.Is the relationship between X and Y positive or negative?
b.What is the slope when X = 4?
c.What is the slope when X = 8?
(Essay)
4.9/5 (33)
The statement that "increases in the tax on gasoline increase the price of gasoline" is an example of a
(Multiple Choice)
4.9/5 (40)
Two variables are unrelated if their graph is
i.a vertical line.
ii.a 45 degree line.
iii.a horizontal line.
(Multiple Choice)
4.8/5 (36)
Nathan drinks three cups of coffee per day.The marginal benefit that he enjoys from drinking the third cup is
(Multiple Choice)
4.8/5 (35)
The tendency for the values of two variables to move in a predictable and related way is known as
(Multiple Choice)
4.7/5 (29)
Mothers Against Drunk Drivers (MADD)campaigned to increase the legal penalties of drunk driving.This successful campaign ________ of drunk driving.
(Multiple Choice)
4.8/5 (34)
Huey has eaten two hamburgers and is considering a third.The marginal benefit in his decision is the pleasure from consuming
(Multiple Choice)
4.8/5 (33)
Filters
- Essay(0)
- Multiple Choice(0)
- Short Answer(0)
- True False(0)
- Matching(0)