Exam 1: Getting Started
Exam 1: Getting Started347 Questions
Exam 2: The U.S.and Global Economies211 Questions
Exam 3: The Economic Problem283 Questions
Exam 4: Demand and Supply334 Questions
Exam 5: Elasticities of Demand and Supply342 Questions
Exam 6: Efficiency and Fairness of Markets364 Questions
Exam 7: Government Actions in Markets248 Questions
Exam 8: Taxes270 Questions
Exam 9: Global Markets in Action281 Questions
Exam 10: Externalities301 Questions
Exam 11: Public Goods and Common Resources180 Questions
Exam 12: Markets with Private Information103 Questions
Exam 13: Consumer Choice and Demand295 Questions
Exam 14: Production and Cost274 Questions
Exam 15: Perfect Competition285 Questions
Exam 16: Monopoly384 Questions
Exam 17: Monopolistic Competition221 Questions
Exam 18: Oligopoly228 Questions
Exam 19: Markets for Factors of Production188 Questions
Exam 20: Economic Inequality164 Questions
Select questions type
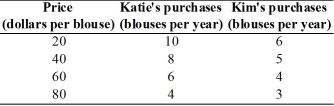 -The table above shows how many blouses Katie and Kim will purchase at different prices for a blouse.In the figure,label the axes and put the price on the y-axis and the quantity of blouses on the x-axis.Plot the data for Katie in the figure.Then,plot the data for Kim in the figure.
(Essay)
4.9/5  (35)
(35)
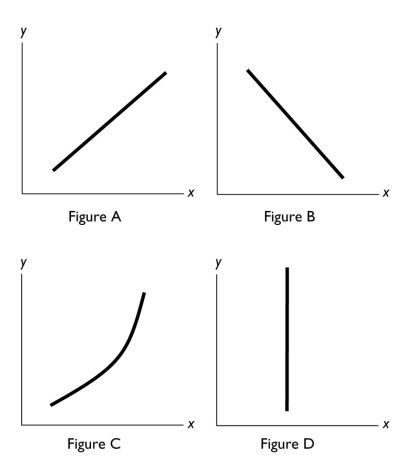 -In the diagram above,which figure(s)show(s)no relationship between the variables?
(Multiple Choice)
4.9/5 (31)
A normative statement
i.can be tested as to whether it is true or false.
ii.is considered negative.
iii.depends on a person's values.
(Multiple Choice)
4.9/5 (35)
In New State,the bottling law requires that people get a refund of five cents when they return an empty bottle or can.Why does the state pay people to return bottles? In your answer,be sure to mention the role played by rational choice.
(Essay)
4.9/5 (44)
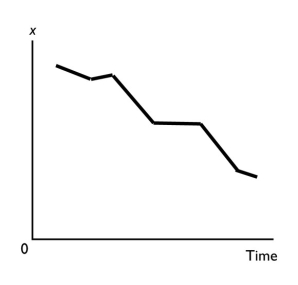
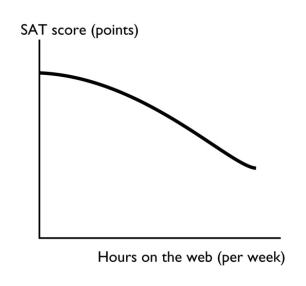 -The figure above shows how the relationship between the number of hours per week a high school student spends on the web and the student's SAT score.Is the relationship between hours on the web and the SAT score positive,negative,neither? Explain your answer.
(Essay)
4.8/5 (36)
 -A graph shows the average wage of various demographic groups in 2012.The kind of graph used to show these data would be a
(Multiple Choice)
4.8/5 (27)
A graph that shows how the amount of advertising expenditure differs among various industries can be shown
(Multiple Choice)
4.9/5 (36)
By donating $1,000 to the Salvation Army,Caroline reduces her taxable income.To Caroline,the reduction in her taxable income is
(Multiple Choice)
4.9/5 (33)
Which of the following is NOT a normative economic statement?
(Multiple Choice)
4.8/5 (34)
You have chosen to take a trip during spring break.If you had not gone,you would either have worked at a temporary job or studied for exams.The opportunity cost of your trip is
(Multiple Choice)
4.8/5 (29)
The question of "What goods and services get produced?" most closely relates to which of the following issues?
(Multiple Choice)
4.7/5 (35)
A graph shows the wage rate of factory workers.The slope of the line is positive for periods when the wage rate is
(Multiple Choice)
5.0/5 (37)
Filters
- Essay(0)
- Multiple Choice(0)
- Short Answer(0)
- True False(0)
- Matching(0)