Exam 1: Getting Started
Exam 1: Getting Started347 Questions
Exam 2: The U.S.and Global Economies211 Questions
Exam 3: The Economic Problem283 Questions
Exam 4: Demand and Supply334 Questions
Exam 5: Elasticities of Demand and Supply342 Questions
Exam 6: Efficiency and Fairness of Markets364 Questions
Exam 7: Government Actions in Markets248 Questions
Exam 8: Taxes270 Questions
Exam 9: Global Markets in Action281 Questions
Exam 10: Externalities301 Questions
Exam 11: Public Goods and Common Resources180 Questions
Exam 12: Markets with Private Information103 Questions
Exam 13: Consumer Choice and Demand295 Questions
Exam 14: Production and Cost274 Questions
Exam 15: Perfect Competition285 Questions
Exam 16: Monopoly384 Questions
Exam 17: Monopolistic Competition221 Questions
Exam 18: Oligopoly228 Questions
Exam 19: Markets for Factors of Production188 Questions
Exam 20: Economic Inequality164 Questions
Select questions type
As the price of home heating oil rises,families buy less home heating oil.Hence a scatter diagram with the price of home heating oil on the vertical axis and the quantity purchased on the horizontal axis reveals a ________ relationship.
(Multiple Choice)
4.9/5  (39)
(39)
Which of the following statements is a normative statement?
(Multiple Choice)
4.8/5 (33)
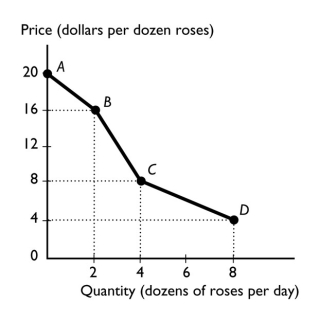 -The figure above shows the relationship between the price of a dozen roses and the quantity of roses a florist can sell.The relationship between the price and the quantity the florist can sell is
(Multiple Choice)
4.8/5 (38)
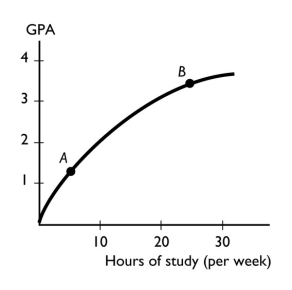 -The figure above shows the relationship between the time a student spends studying and the student's GPA that semester.The slope of the relationship at point A ________ the slope at point B.
(Multiple Choice)
4.7/5 (40)
________ shows the values of a variable for different groups in the population at a certain point in time.
(Multiple Choice)
4.8/5 (35)
The question "Should we produce LCD televisions or computer monitors?" is an example of a ________ question.
(Multiple Choice)
4.9/5 (34)
Must a rational choice always work out well? In other words,is it possible for someone to regret a rational decision?
(Essay)
4.9/5 (39)
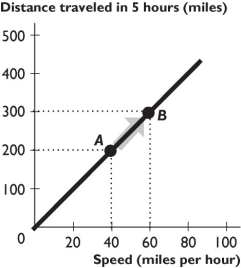 -The relationship between distance traveled in 5 hours and speed shown in the figure above is
(Multiple Choice)
4.8/5 (41)
Filters
- Essay(0)
- Multiple Choice(0)
- Short Answer(0)
- True False(0)
- Matching(0)