Exam 1: Getting Started
Exam 1: Getting Started347 Questions
Exam 2: The U.S.and Global Economies211 Questions
Exam 3: The Economic Problem283 Questions
Exam 4: Demand and Supply334 Questions
Exam 5: Elasticities of Demand and Supply342 Questions
Exam 6: Efficiency and Fairness of Markets364 Questions
Exam 7: Government Actions in Markets248 Questions
Exam 8: Taxes270 Questions
Exam 9: Global Markets in Action281 Questions
Exam 10: Externalities301 Questions
Exam 11: Public Goods and Common Resources180 Questions
Exam 12: Markets with Private Information103 Questions
Exam 13: Consumer Choice and Demand295 Questions
Exam 14: Production and Cost274 Questions
Exam 15: Perfect Competition285 Questions
Exam 16: Monopoly384 Questions
Exam 17: Monopolistic Competition221 Questions
Exam 18: Oligopoly228 Questions
Exam 19: Markets for Factors of Production188 Questions
Exam 20: Economic Inequality164 Questions
Select questions type
A graph shows the price of a pound of cucumbers on the vertical axis and the quantity of new cars sold by Honda on the horizontal axis.The price of a pound of cucumbers remains constant as the quantity of new cars sold increases.The graph of these data is a
(Multiple Choice)
4.8/5  (32)
(32)
If whenever one variable increases,another variable also increases,then these two variables are ________ related.
(Multiple Choice)
4.8/5 (38)
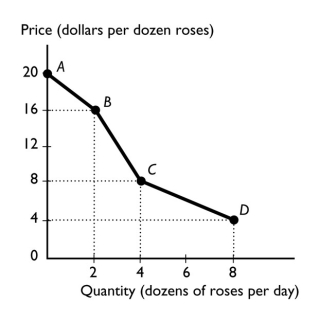 -The figure above shows the relationship between the price of a dozen roses and the quantity of roses a florist can sell.The slope between points C and D equals
(Multiple Choice)
4.9/5 (30)
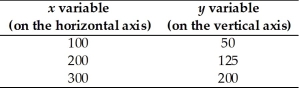 -The table above shows data on two variables.If these data were graphed,the slope of the line would be
(Multiple Choice)
5.0/5 (41)
As the number of days without rain increases,the amount of wheat grown per acre declines.A graph showing this relationship shows
(Multiple Choice)
4.9/5 (36)
When the Dallas Cowboys score more than 30 points in a game,they win the game.This is an example of
(Multiple Choice)
4.9/5 (27)
In a graph,a straight line has a negative slope if the line
(Multiple Choice)
4.9/5 (38)
What are the two different types of relationships that variables can have? Explain each.What do these relationships look like when they are graphed?
(Essay)
4.8/5 (31)
When the power company decides to use manpower to bury its lines,it directly answers the ________ question.
(Multiple Choice)
4.8/5 (38)
On a graph showing the relationship between x and y,the ceteris paribus condition implies that
(Multiple Choice)
4.8/5 (40)
The marginal cost of an activity ________ as you do more of it.
(Multiple Choice)
4.8/5 (39)
"As the price of gasoline increases,fewer people buy cars that are gas guzzlers." A graph showing this relationship would
(Multiple Choice)
4.9/5 (30)
Which of the following is true regarding a normative statement?
i.It uses the ceteris paribus assumption.
ii.It is a value judgment.
iii.It accounts for opportunity costs.
(Multiple Choice)
4.8/5 (38)
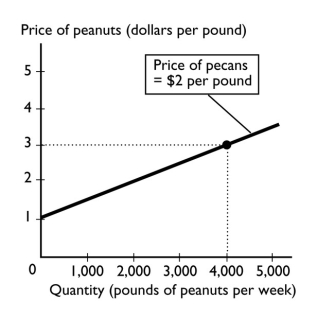 -The above figure shows how many pounds of peanuts farmers are willing to sell at different prices per pound of peanuts.If the price of a pound of peanuts is $1 and the price of a pound of pecans is $2,peanut farmers are willing to sell
(Multiple Choice)
4.9/5 (34)
Which of the following scenarios describes an action that is not rational from an economic point of view?
(Multiple Choice)
4.8/5 (28)
Filters
- Essay(0)
- Multiple Choice(0)
- Short Answer(0)
- True False(0)
- Matching(0)