Exam 1: Getting Started
Exam 1: Getting Started347 Questions
Exam 2: The U.S.and Global Economies211 Questions
Exam 3: The Economic Problem283 Questions
Exam 4: Demand and Supply334 Questions
Exam 5: Elasticities of Demand and Supply342 Questions
Exam 6: Efficiency and Fairness of Markets364 Questions
Exam 7: Government Actions in Markets248 Questions
Exam 8: Taxes270 Questions
Exam 9: Global Markets in Action281 Questions
Exam 10: Externalities301 Questions
Exam 11: Public Goods and Common Resources180 Questions
Exam 12: Markets with Private Information103 Questions
Exam 13: Consumer Choice and Demand295 Questions
Exam 14: Production and Cost274 Questions
Exam 15: Perfect Competition285 Questions
Exam 16: Monopoly384 Questions
Exam 17: Monopolistic Competition221 Questions
Exam 18: Oligopoly228 Questions
Exam 19: Markets for Factors of Production188 Questions
Exam 20: Economic Inequality164 Questions
Select questions type
When Delta decides to quit flying to Lithuania,it directly answers the ________ question.
(Multiple Choice)
4.8/5  (38)
(38)
Which of the following is an example of a normative statement?
(Multiple Choice)
4.8/5 (40)
What does the slope of a straight line equal? How is the slope of a curved line calculated?
(Essay)
4.8/5 (35)
Which of the following is an example of a normative economic statement?
(Multiple Choice)
4.9/5 (39)
A graph of two variables is a vertical line.What is the interpretation of this result?
(Essay)
5.0/5 (39)
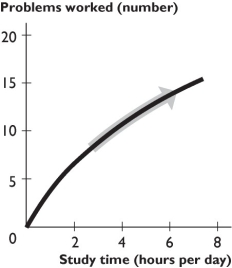 -The figure above shows the relationship between study time and the number of problems worked.The curve becomes less steep because as you study more,
(Multiple Choice)
4.8/5 (31)
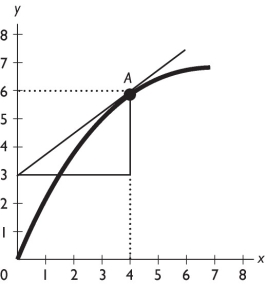 -In the figure above,what is the slope of the curve at point A?
(Multiple Choice)
4.8/5 (36)
John has two hours of free time this evening.He ranked his alternatives,first go to a concert,second go to a movie,third study for an economics exam,and fourth answer his e-mail.What is the opportunity cost of attending the concert for John?
(Multiple Choice)
4.9/5 (31)
Moving rightward along a straight line,the slope of the line
(Multiple Choice)
4.9/5 (36)
An independent relationship between two variables is shown in a graph by
(Multiple Choice)
4.8/5 (33)
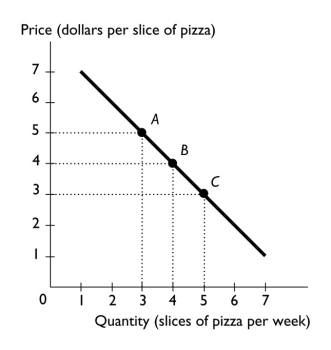 -The above figure shows the relationship between the price of a slice of pizza and how many slices of pizza Ricardo buys in a week.Between points A and B,the slope of the line is ________ the slope of the line between points B and C.
(Multiple Choice)
4.9/5 (44)
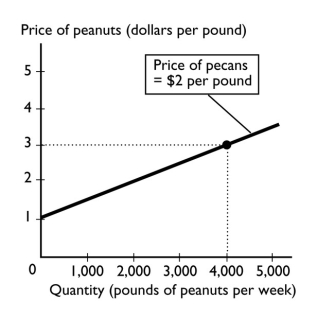 -In the figure above,suppose the price of a pound of pecans is negatively related to the quantity of peanuts that farmers are willing to supply.If the price of pecans increases,
(Multiple Choice)
4.8/5 (36)
When two variables in a graph are related to a third,changing the third causes
(Multiple Choice)
4.8/5 (32)
Filters
- Essay(0)
- Multiple Choice(0)
- Short Answer(0)
- True False(0)
- Matching(0)