Exam 1: Getting Started
Exam 1: Getting Started347 Questions
Exam 2: The U.S.and Global Economies211 Questions
Exam 3: The Economic Problem283 Questions
Exam 4: Demand and Supply334 Questions
Exam 5: Elasticities of Demand and Supply342 Questions
Exam 6: Efficiency and Fairness of Markets364 Questions
Exam 7: Government Actions in Markets248 Questions
Exam 8: Taxes270 Questions
Exam 9: Global Markets in Action281 Questions
Exam 10: Externalities301 Questions
Exam 11: Public Goods and Common Resources180 Questions
Exam 12: Markets with Private Information103 Questions
Exam 13: Consumer Choice and Demand295 Questions
Exam 14: Production and Cost274 Questions
Exam 15: Perfect Competition285 Questions
Exam 16: Monopoly384 Questions
Exam 17: Monopolistic Competition221 Questions
Exam 18: Oligopoly228 Questions
Exam 19: Markets for Factors of Production188 Questions
Exam 20: Economic Inequality164 Questions
Select questions type
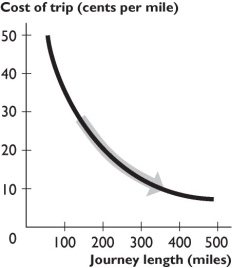 -The figure above shows the relationship between the journey length and the cost of trip per mile.The curve becomes flatter because as the journey length increases,
(Multiple Choice)
4.7/5  (29)
(29)
In making your decision whether to take a trip during spring break,you compare all the other activities you could undertake.As a result,you
(Multiple Choice)
4.8/5 (34)
A graph has a point that is either a maximum or a minimum.To the left of the point,the slope of relationship is positive.To the right of the point,the slope is negative.Is the point a maximum point or a minimum point? Be sure to draw a figure that supports your answer.
(Essay)
4.9/5 (34)
List and explain the three fundamental economic questions that must be answered by all economic systems.
(Essay)
4.9/5 (36)
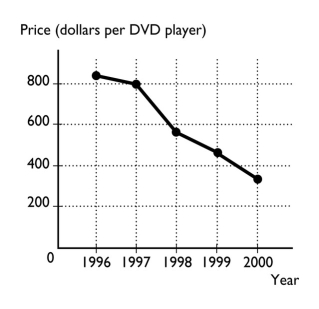 -The figure above shows the price of a DVD player from 1996 to 2000.
a.What type of graph is illustrated above?
b.What is the trend in the price of a DVD player?
-The figure above shows the price of a DVD player from 1996 to 2000.
a.What type of graph is illustrated above?
b.What is the trend in the price of a DVD player?
(Essay)
4.8/5 (30)
Kevin is re-finishing an antique grandfather clock that he purchased at a flea market for $300.He expects to be able to sell the clock for $450.At the last minute,Kevin discovers that he needs to repair the gears at a cost of $175 to make the clock worth $450 to potential buyers.It turns out that he could also sell the clock now,without completing the additional repairs,for $250.What should Kevin do?
(Multiple Choice)
4.8/5 (27)
The question of "How are goods and services produced?" most closely addresses which of the following issues?
(Multiple Choice)
4.8/5 (31)
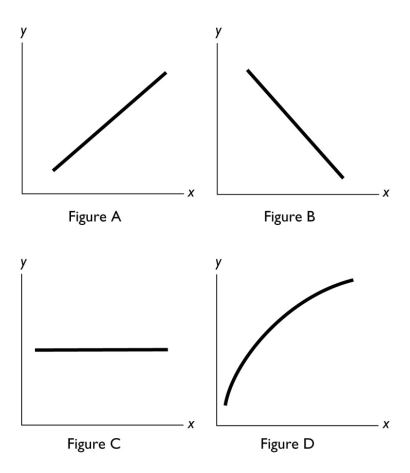 -In the above figure,no relationship between x and y is shown in Figure
(Multiple Choice)
4.7/5 (35)
Three variables are related and two of them are plotted in a figure.If the variable that is not measured on either the x-axis or the y-axis changes,then there is
(Multiple Choice)
4.8/5 (37)
The question "Should economics majors or sociology majors earn more after they graduate?" is an example of a ________ question.
(Multiple Choice)
4.8/5 (40)
If the marginal benefit of the next slice of pizza exceeds the marginal cost,you will
(Multiple Choice)
4.8/5 (32)
Filters
- Essay(0)
- Multiple Choice(0)
- Short Answer(0)
- True False(0)
- Matching(0)