Exam 8: Aggregate Expenditure and Equilibrium Output
Exam 1: The Scope and Method of Economics65 Questions
Exam 2: The Economic Problem: Scarcity and Choice107 Questions
Exam 3: Demand, Supply, and Market Equilibrium86 Questions
Exam 4: Demand and Supply Applications37 Questions
Exam 5: Introduction to Macroeconomics64 Questions
Exam 6: Measuring National Output and National Income84 Questions
Exam 7: Unemployment, Inflation, and Long-Run Growth81 Questions
Exam 8: Aggregate Expenditure and Equilibrium Output58 Questions
Exam 9: The Government and Fiscal Policy71 Questions
Exam 10: The Money Supply and the Federal Reserve System96 Questions
Exam 11: Money Demand and the Equilibrium Interest Rate96 Questions
Exam 12: The Determination of Aggregate Output, the Price Level, and the Interest Rate100 Questions
Exam 13: Policy Effects and Costs Shocks in the Asad Model89 Questions
Exam 14: The Labor Market in the Macroeconomy111 Questions
Exam 15: Financial Crises, Stabilization, and Deficits102 Questions
Exam 16: Household and Firm Behavior in the Macroeconomy: a Further Look92 Questions
Exam 17: Long-Run Growth59 Questions
Exam 18: Alternative Views in Macroeconomics88 Questions
Exam 19: International Trade, Comparative Advantage, and Protectionism63 Questions
Exam 20: Open-Economy Macroeconomics: the Balance of Payments and Exchange Rates105 Questions
Exam 21: Economic Growth in Developing and Transitional Economies48 Questions
Select questions type
Determine what the level of unplanned investment would be under each of the following scenarios: a) aggregate output is greater than planned spending, b) aggregate output is equal to planned spending and c) aggregate output is less than planned spending.
(Essay)
4.8/5  (38)
(38)
Assume consumption is represented by the following: C = 400 + .75Y. Also assume that planned investment (I) equals 100.
(Essay)
4.9/5 (47)
Assume the following saving function and investment function: S = -200 + .25Y and I = 25. Calculate the equilibrium output level.
(Essay)
4.8/5 (34)
In the General Theory, Keynes argued that the amount of consumption undertaken by a household is directly related to its income. Explain what he meant.
(Essay)
4.7/5 (48)
Assume that at every level of output households reduce their level of saving by the same absolute amount. Explain what impact if any this will have on the value of the multiplier.
(Essay)
4.7/5 (47)
Explain what effect an increase in the marginal propensity to save will have on the slope of the planned aggregate expenditures line and on the size of the multiplier.
(Essay)
4.8/5 (36)
Explain why the multiplier that is calculated in the textbook and the size of the multiplier in the real world are likely to be different. What are the two reasons?
(Essay)
4.9/5 (30)
When planned aggregate expenditure exceeds aggregate output (income), there is an unplanned fall in inventories. Firms will increase output. This increased output leads to increased income and even more consumption. How long will this process continue?
(Essay)
4.7/5 (42)
Define the significance of equilibrium in the macroeconomics goods market.
(Essay)
4.9/5 (31)
What are the four determinants of consumption? Also, explain how a change in each would bring about a reduction in consumption.
(Essay)
4.9/5 (39)
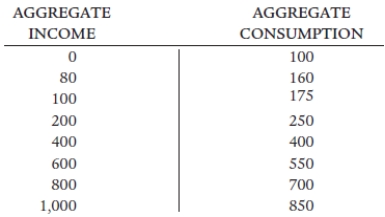 Figure 23.2
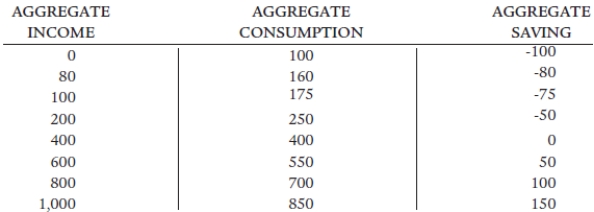
-Using Figure 23.2 calculate aggregate saving at each income level.
Figure 23.2
-Using Figure 23.2 calculate aggregate saving at each income level.
(Essay)
4.8/5 (38)
Assume a consumption function that takes on the following algebraic form: C = $100 + .8Y. Assume that Y = $1000 what is the level of consumption at this income level.
(Essay)
4.8/5 (37)
Theoretically, what should happen to the value of the multiplier along a consumption function that is increasing at a decreasing rate?
(Essay)
4.7/5 (35)
 -Using the above figure calculate the marginal propensity to consume between the aggregate income levels of $80 and $100. Also explain why this consumption function is linear.
(Essay)
4.9/5 (37)
Assume an economy with the following consumption and investment function:
C = 100 + .75Y
I = 25
Based on this information fill in the following table:
 Put an asterisk next to the aggregate output level that shows equilibrium.
(Essay)
4.8/5 (42)
Explain what is meant by the multiplier and explain what variable (s) determines its size.
(Essay)
4.9/5 (32)
Critically evaluate the following statement. "People can spend more than their income by borrowing therefore the sum of the MPC and the MPS could actually be greater than one."
(Essay)
4.7/5 (40)
Filters
- Essay(0)
- Multiple Choice(0)
- Short Answer(0)
- True False(0)
- Matching(0)