Exam 18: Time Series and Forecasting
Exam 1: Statistics and Data100 Questions
Exam 2: Tabular and Graphical Methods123 Questions
Exam 3: Numerical Descriptive Measures151 Questions
Exam 4: Basic Probability Concepts116 Questions
Exam 5: Discrete Probability Distributions139 Questions
Exam 6: Continuous Probability Distributions128 Questions
Exam 7: Sampling and Sampling Distributions124 Questions
Exam 8: Interval Estimation123 Questions
Exam 9: Hypothesis Testing135 Questions
Exam 10: Statistical Inference Concerning Two Populations124 Questions
Exam 11: Statistical Inference Concerning Variance111 Questions
Exam 12: Chi-Square Tests120 Questions
Exam 13: Analysis of Variance58 Questions
Exam 14: Regression Analysis140 Questions
Exam 15: Inference With Regression Models124 Questions
Exam 16: Regression Models for Nonlinear Relationships115 Questions
Exam 17: Regression Models With Dummy Variables114 Questions
Exam 18: Time Series and Forecasting124 Questions
Exam 19: Returns, Index Numbers and Inflation120 Questions
Exam 20: Nonparametric Tests108 Questions
Select questions type
Prices of crude oil have been steadily rising over the last two years (The Wall Street Journal,December 14,2010).The monthly data on price per gallon of unleaded regular gasoline in the United States from January 2009 to December 2010 were available.Three trend models were created,and the following relevant information became available. 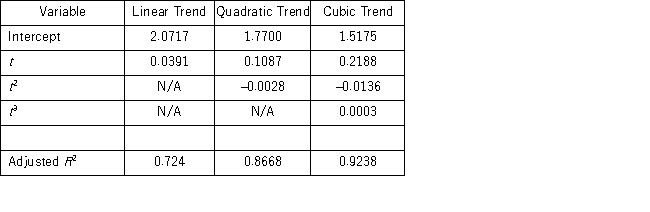 Based on adjusted R2,which of the following models is the most appropriate for making a forecast for the price of regular unleaded gasoline?
(Multiple Choice)
4.9/5  (44)
(44)
In the decomposition method,which of the following time series is used to estimate the trend?
(Multiple Choice)
4.8/5 (33)
Given the estimated model  = b0 + b1t,the one-step-ahead and multistep-ahead forecasts are possible,if we know,or can predict,future values of the ______________.
(Multiple Choice)
4.9/5 (37)
The following ratio-to-moving averages for the seasonally adjusted series were found by the decomposition method applied on a time series representing quarterly sales for the last three years:  Which of the following is the seasonal index for the fourth quarter?
(Multiple Choice)
4.8/5 (27)
In a moving average method,when a new observation becomes available,the new average is computed by including the new observation and ________ .
(Multiple Choice)
4.9/5 (43)
Quantitative forecasting procedures are based on the judgment of the forecaster,who uses prior experience and expertise to make forecasts.
(True/False)
4.9/5 (39)
Which of the following is true of the exponential smoothing method?
(Multiple Choice)
4.9/5 (41)
The seasonal component typically represents repetitions over a ________ period.
(Essay)
4.9/5 (33)
When comparing polynomial trend models,we use adjusted R2,which imposes a penalty for ________________.
(Essay)
4.9/5 (36)
A time series with observed long-term upward movements in its values is said to have _________________.
(Multiple Choice)
5.0/5 (30)
Quarterly sales of a department store for the last seven years are given in the following table. 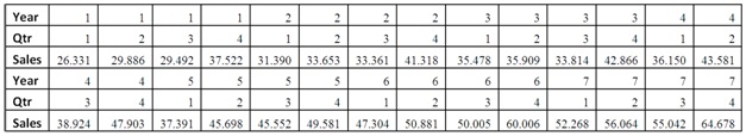
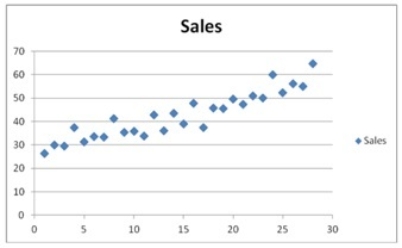 The Excel scatterplot shown indicates that the quarterly sales have an increasing trend and seasonality.Therefore,the linear regression model,Sales = β0 + β1Qtr1 + β2Qtr2 + β3Qtr3 + β4t + ε,with three seasonal dummy variables Qtr1,Qtr2,and Qtr3,and the decomposition method are proposed to make sales forecasts.For the regression model,the following Excel partial output is available.
 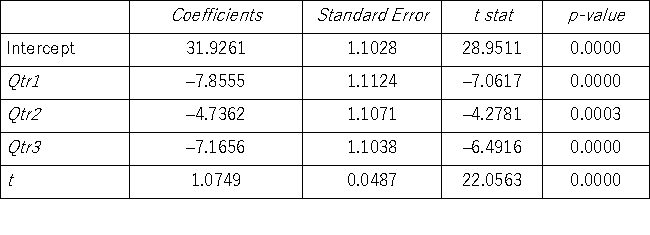 What is the regression equation for the linear trend model with seasonal dummy variables?
(Essay)
4.7/5 (33)
The following ratio-to-moving averages for the seasonally adjusted series were found by the decomposition method applied on a time series representing quarterly sales for the last three years: 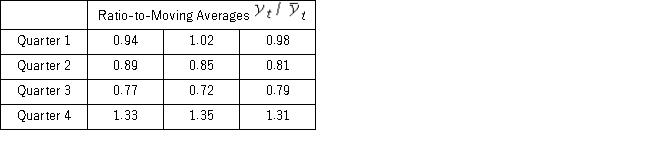 By what percent does the sales in Quarter 4 exceed the average quarterly sales?
(Multiple Choice)
4.8/5 (26)
To extract the trend from a time series,we first eliminate seasonal _________ by dividing the original series y,by its corresponding adjusted seasonal index.
(Essay)
4.8/5 (44)
In the quadratic trend model,yt = β0 + β1t2 + εt,which coefficient determines if the trend is going to be U-shaped or inverted U-shaped?
(Multiple Choice)
4.9/5 (31)
The past monthly demands are shown below.The naïve method,that is,the one-period moving average method,is applied to make forecasts.  If the demand in May appears to be 35,what is the residual (error)for May?
(Multiple Choice)
4.7/5 (33)
Under which of the following conditions is qualitative forecasting considered attractive?
(Multiple Choice)
4.9/5 (39)
Which of the following is not true of a time series with a cyclical component?
(Multiple Choice)
5.0/5 (40)
The following table shows the annual revenues (in millions of dollars)of a pharmaceutical company over the period 1990-2011. 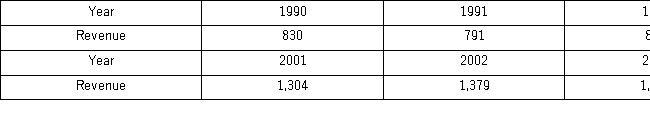
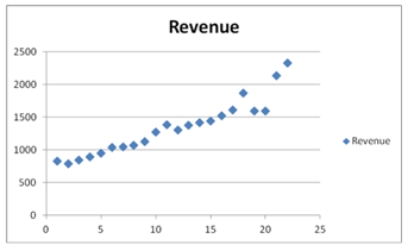 The Excel scatterplot shown indicates that the annual revenues have an increasing trend.Therefore,linear,exponential,quadratic,and cubic models were used to fit the trend,and the following relevant information became available after applying linear regression.
 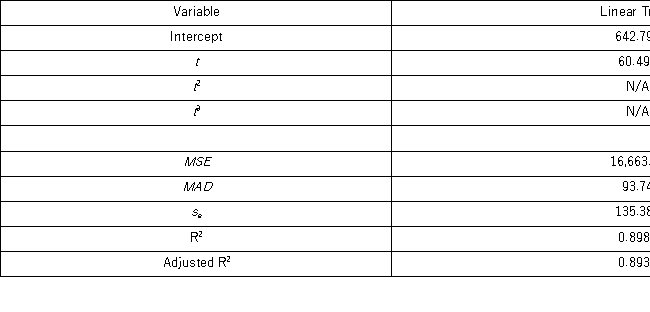 When all four trend regression equations are compared,which of them provides the best fit?
(Multiple Choice)
4.8/5 (39)
Filters
- Essay(0)
- Multiple Choice(0)
- Short Answer(0)
- True False(0)
- Matching(0)