Exam 18: Time Series and Forecasting
Exam 1: Statistics and Data100 Questions
Exam 2: Tabular and Graphical Methods123 Questions
Exam 3: Numerical Descriptive Measures151 Questions
Exam 4: Basic Probability Concepts116 Questions
Exam 5: Discrete Probability Distributions139 Questions
Exam 6: Continuous Probability Distributions128 Questions
Exam 7: Sampling and Sampling Distributions124 Questions
Exam 8: Interval Estimation123 Questions
Exam 9: Hypothesis Testing135 Questions
Exam 10: Statistical Inference Concerning Two Populations124 Questions
Exam 11: Statistical Inference Concerning Variance111 Questions
Exam 12: Chi-Square Tests120 Questions
Exam 13: Analysis of Variance58 Questions
Exam 14: Regression Analysis140 Questions
Exam 15: Inference With Regression Models124 Questions
Exam 16: Regression Models for Nonlinear Relationships115 Questions
Exam 17: Regression Models With Dummy Variables114 Questions
Exam 18: Time Series and Forecasting124 Questions
Exam 19: Returns, Index Numbers and Inflation120 Questions
Exam 20: Nonparametric Tests108 Questions
Select questions type
Based on quarterly data collected over the last five years,the following regression equation was found to forecast the quarterly demand for the number of new copies of a business statistics textbook:  = 2,298 - 6635Qtr1 - 1,446Qtr2 + 303Qtr3 + 26t,where Qtr1,Qtr2,and Qtr3 are dummy variables corresponding to Quarters 1,2,and 3,and t = time period. The demand forecast for the second quarter of the next year is ______.
(Multiple Choice)
4.8/5  (32)
(32)
The following table shows the annual revenues (in millions of dollars)of a pharmaceutical company over the period 1990-2011. 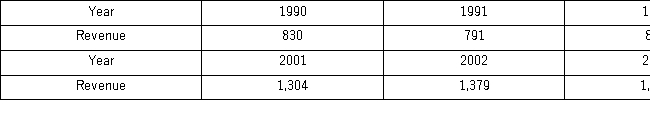
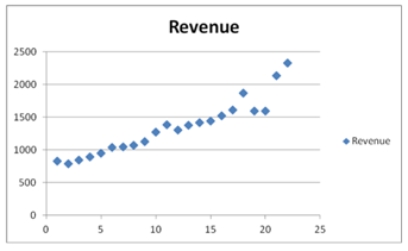 The Excel scatterplot shown indicates that the annual revenues have an increasing trend.Therefore,linear,exponential,quadratic,and cubic models were used to fit the trend,and the following relevant information became available after applying linear regression.
 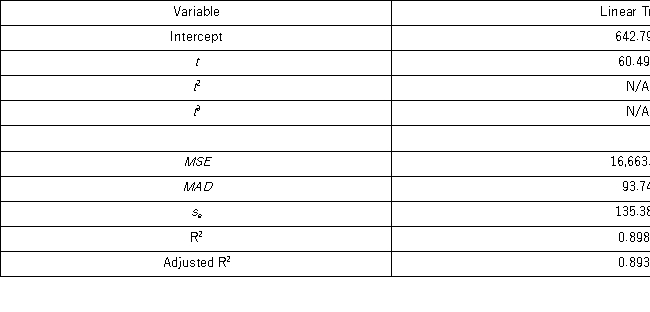 Which of the following is a revenue forecast for 2012 found by the polynomial trend equation with the best fit?
(Multiple Choice)
4.8/5 (33)
When the increase in the series gets larger over time,it is attractive to use the __________ trend model.
(Essay)
4.7/5 (32)
The cyclical component of a time series typically represents repetitions within a one-year period.
(True/False)
4.9/5 (40)
The past monthly demands are shown below.The naïve method,that is,the one-period moving average method,is applied to make forecasts. 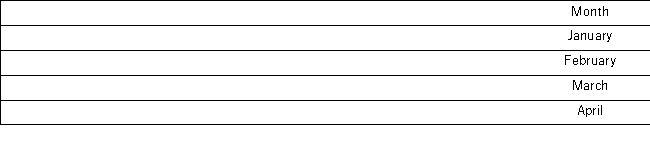 What is the mean absolute deviation (MAD)of the forecasts?
(Multiple Choice)
4.9/5 (34)
When using Excel to calculate an exponentially smoothed series,we first activate the Exponential Smoothing dialog box.After selecting the relevant time series we have to select the box next to Damping Factor.If we want to construct an exponentially smoothed series with α,then for Damping Factor we enter _____.
(Multiple Choice)
4.7/5 (35)
The following table includes the information about a monthly time series.  What is the forecast for May using the exponential smoothing method with α = 0.1?
(Multiple Choice)
4.9/5 (44)
Quarterly sales of a department store for the last seven years are given in the following table. 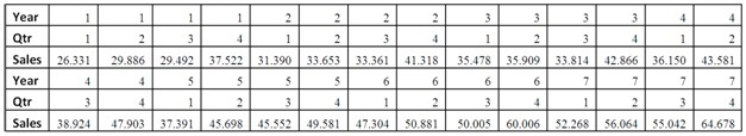
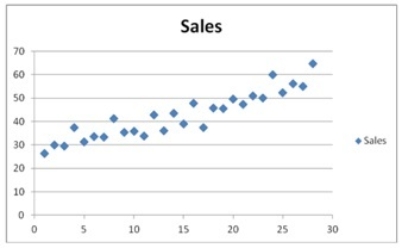 The Excel scatterplot shown indicates that the quarterly sales have an increasing trend and seasonality.Therefore,the linear regression model,Sales = β0 + β1Qtr1 + β2Qtr2 + β3Qtr3 + β4t + ε,with three seasonal dummy variables Qtr1,Qtr2,and Qtr3,and the decomposition method are proposed to make sales forecasts.For the regression model,the following Excel partial output is available.
 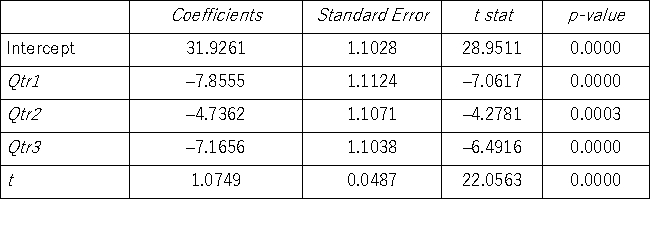 Using the regression equation for the linear trend model with seasonal dummy variables,what is the sales forecast for the first quarter of Year 8?
(Essay)
4.9/5 (39)
Prices of crude oil have been steadily rising over the last two years (The Wall Street Journal,December 14,2010).The monthly data on price per gallon of unleaded regular gasoline in the United States from January 2009 to December 2010 were available.Three trend models were created,and the following relevant information became available. 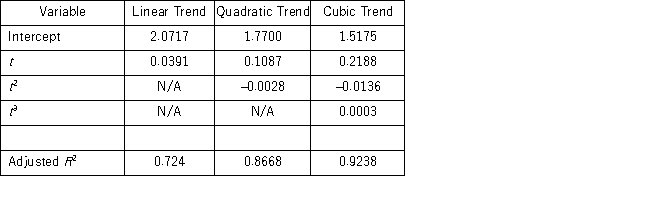 Which of the following would be a difference in the forecasts for the price of regular unleaded gasoline for February 2011 comparing two trend models: cubic and quadratic?
(Multiple Choice)
4.7/5 (38)
The following table includes the information about a monthly time series.  When the exponential smoothing method with α = 0.1 is applied,what is the MAD?
(Multiple Choice)
4.8/5 (35)
In comparison with the linear trend model,which of the following is not true of the cubic trend model?
(Multiple Choice)
4.9/5 (38)
Which of the following equations is a one-period-ahead forecast of the autoregressive model AR(1)?
(Multiple Choice)
4.7/5 (32)
If there are T observations (yi,xi)to estimate the lagged regression model yt = β0 + β1xt - 1 + εt,what is the actual number of observations used to make the forecast for time period T?
(Multiple Choice)
4.7/5 (39)
With the method of seasonal dummy variables,we estimate a trend forecasting model that includes _________ dummies.
(Essay)
4.8/5 (36)
The following table shows the annual revenues (in millions of dollars)of a pharmaceutical company over the period 1990-2011. 
 The Excel scatterplot shown indicates that the annual revenues have an increasing trend.Therefore,linear,exponential,quadratic,and cubic models were used to fit the trend,and the following relevant information became available after applying linear regression.
  Which of the following is a revenue forecast for 2012 found by the exponential trend equation?
(Multiple Choice)
4.7/5 (41)
Which of the following is a criticism made of qualitative forecasts?
(Multiple Choice)
4.7/5 (42)
When the modelyt = Tt × St × It is assumed,to identify the _______,we have to find the seasonally adjusted series.
(Multiple Choice)
4.8/5 (32)
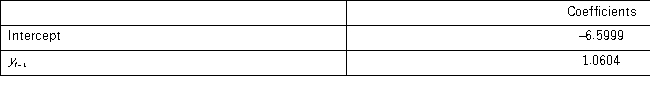
The following table shows the annual revenues (in millions of dollars)of a pharmaceutical company over the period 1990-2011.  The autoregressive models of order 1 and 2,yt = β0 + β1yt - 1 + εt,and yt = β0 + β1yt - 1 + β2yt - 2 + εt,were applied on the time series to make revenue forecasts.The relevant parts of Excel regression outputs are given below.
Model AR(1):
The autoregressive models of order 1 and 2,yt = β0 + β1yt - 1 + εt,and yt = β0 + β1yt - 1 + β2yt - 2 + εt,were applied on the time series to make revenue forecasts.The relevant parts of Excel regression outputs are given below.
Model AR(1): 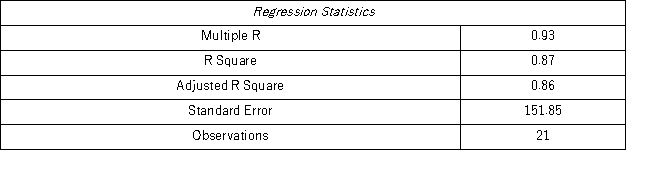
 Model AR(2):
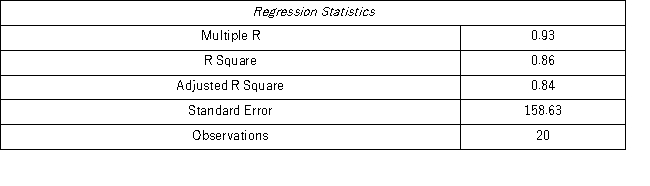
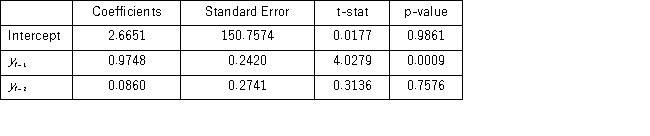 Using the AR(1)model,find the company revenue forecast for 2012.
(Essay)
4.7/5 (36)
Filters
- Essay(0)
- Multiple Choice(0)
- Short Answer(0)
- True False(0)
- Matching(0)