Exam 18: Time Series and Forecasting
Exam 1: Statistics and Data100 Questions
Exam 2: Tabular and Graphical Methods123 Questions
Exam 3: Numerical Descriptive Measures151 Questions
Exam 4: Basic Probability Concepts116 Questions
Exam 5: Discrete Probability Distributions139 Questions
Exam 6: Continuous Probability Distributions128 Questions
Exam 7: Sampling and Sampling Distributions124 Questions
Exam 8: Interval Estimation123 Questions
Exam 9: Hypothesis Testing135 Questions
Exam 10: Statistical Inference Concerning Two Populations124 Questions
Exam 11: Statistical Inference Concerning Variance111 Questions
Exam 12: Chi-Square Tests120 Questions
Exam 13: Analysis of Variance58 Questions
Exam 14: Regression Analysis140 Questions
Exam 15: Inference With Regression Models124 Questions
Exam 16: Regression Models for Nonlinear Relationships115 Questions
Exam 17: Regression Models With Dummy Variables114 Questions
Exam 18: Time Series and Forecasting124 Questions
Exam 19: Returns, Index Numbers and Inflation120 Questions
Exam 20: Nonparametric Tests108 Questions
Select questions type
When using Excel for calculating moving averages,the Moving Average dialog box should be activated.The value of m - the number of periods should be entered in the box named ______.
(Multiple Choice)
4.8/5  (30)
(30)
The following table includes the information about a monthly time series.  When a forecast is made by the three-month moving average method,all three monthly observations used to make this forecast are treated equally in the sense that each of them has the same weight of 1/3.What is the forecast for May when the three-month weighted moving average method is applied with the weights: 1/6,2/6,and 3/6? Assign the smallest weight to the oldest data and the largest weight to the most recent data.
(Multiple Choice)
4.9/5 (38)
__________ patterns are caused by the presence of a random error term.
(Essay)
4.8/5 (46)
The following table shows the annual revenues (in millions of dollars)of a pharmaceutical company over the period 1990-2011. 
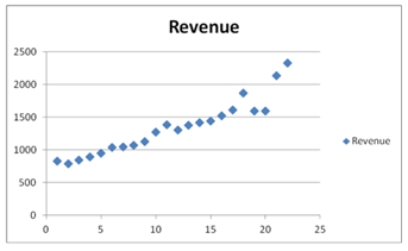 The Excel scatterplot shown indicates that the annual revenues have an increasing trend.Therefore,linear,exponential,quadratic,and cubic models were used to fit the trend,and the following relevant information became available after applying linear regression.
 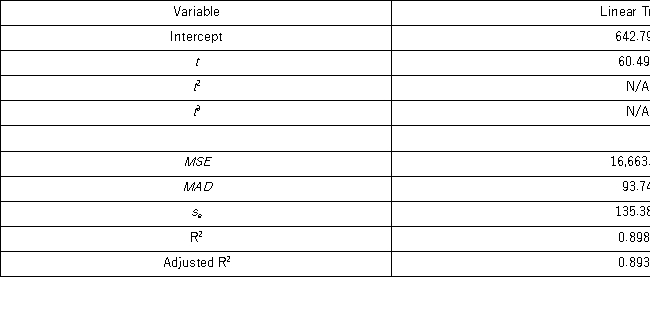 Which of the following is the revenue forecast for 2013 found by the trend regression equation with the best fit?
(Multiple Choice)
5.0/5 (30)
All criteria used for selecting the best forecasting method _______.
(Multiple Choice)
4.8/5 (29)
Based on quarterly data collected over the last four years,the following regression equation was found to forecast the quarterly demand for the number of new copies of an economics textbook:  = 3,305 - 665Qtr1 - 1,335Qtr2 + 305Qtr3,where Qtr1,Qtr2,and Qtr3 are dummy variables corresponding to Quarters 1,2,and 3. The demand forecast for Quarter 2 of the next year is _______.
(Multiple Choice)
4.8/5 (33)
The optimal value of the speed of decline in the exponential smoothing procedure is determined by a(n)_________ method.
(Essay)
4.7/5 (33)
The following table includes the information about a monthly time series.  What is the forecast for May when the three-month moving average method is applied?
(Multiple Choice)
4.8/5 (32)
The following table includes the information about a monthly time series.  When the exponential smoothing method with α = 0.1 and α = 0.5 is applied,what is the speed of decline for which the mean square error is better? What is this mean?
(Multiple Choice)
4.8/5 (38)
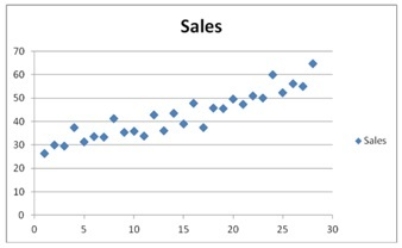
Quarterly sales of a department store for the last seven years are given in the following table. 
 The Excel scatterplot shown indicates that the quarterly sales have an increasing trend and seasonality.Therefore,the linear regression model,Sales = β0 + β1Qtr1 + β2Qtr2 + β3Qtr3 + β4t + ε,with three seasonal dummy variables Qtr1,Qtr2,and Qtr3,and the decomposition method are proposed to make sales forecasts.For the regression model,the following Excel partial output is available.
 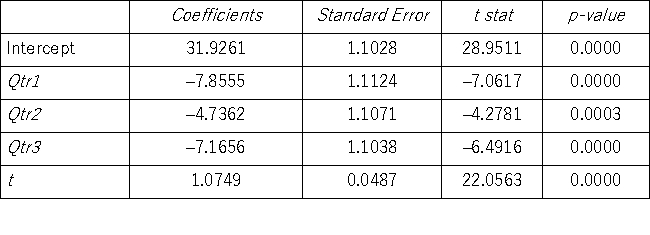 Using the regression equation for the linear trend model with seasonal dummy variables,what can be said about the sales in Quarter 4 compared to the sales in Quarter 1?
(Essay)
4.8/5 (32)
The following table shows the annual revenues (in millions of dollars)of a pharmaceutical company over the period 1990-2011. 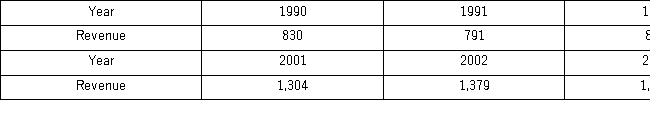
 The Excel scatterplot shown indicates that the annual revenues have an increasing trend.Therefore,linear,exponential,quadratic,and cubic models were used to fit the trend,and the following relevant information became available after applying linear regression.
  Which of the following is an exponential trend equation?
(Multiple Choice)
4.7/5 (44)
Ideally,the chosen model is best in terms of its in-sample predictability and its __________ forecasting ability.
(Essay)
4.8/5 (34)
Quarterly sales of a department store for the last seven years are given in the following table. 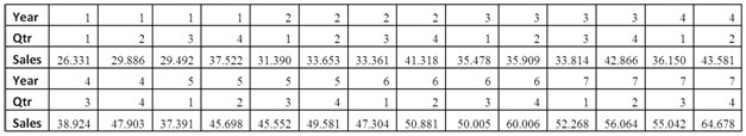
 The Excel scatterplot shown indicates that the quarterly sales have an increasing trend and seasonality.Therefore,the linear regression model,Sales = β0 + β1Qtr1 + β2Qtr2 + β3Qtr3 + β4t + ε,with three seasonal dummy variables Qtr1,Qtr2,and Qtr3,and the decomposition method are proposed to make sales forecasts.For the regression model,the following Excel partial output is available.
  (Use Excel. )Using MSE and MAD,compare the linear trend equation with seasonal dummy variables,
  = 31,9261 - 7.855Qtr1 - 4.7362Qtr2 - 7.1656Qtr3 + 1.0749t,and the decomposition method equation
 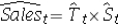 with
with  = 26.8819 + 1.0780t and the quarterly seasonal indices: 0.9322,1.0066,0.9441,and 1.1171.Which of the two corresponding forecasting models is recommended?
(Essay)
4.8/5 (42)
The following table includes the information about a monthly time series.  When the exponential smoothing method with α = 0.1 and α = 0.5 is applied,what is the speed of decline for which the mean absolute deviation is better? What is this mean?
(Multiple Choice)
4.9/5 (36)
Quarterly sales of a department store for the last seven years are given in the following table. 
 The Excel scatterplot shown indicates that the quarterly sales have an increasing trend and seasonality.Therefore,the linear regression model,Sales = β0 + β1Qtr1 + β2Qtr2 + β3Qtr3 + β4t + ε,with three seasonal dummy variables Qtr1,Qtr2,and Qtr3,and the decomposition method are proposed to make sales forecasts.For the regression model,the following Excel partial output is available.
  (Use Excel or statistical software. )Using the decomposition method:
a.Compute the adjusted seasonal indices for the four quarters.
b.Find the linear trend equation for the seasonally adjusted quarterly sales.
c.Make the sales forecasts for the first and fourth quarter of Year 8.
(Use Excel or statistical software. )Using the decomposition method:
a.Compute the adjusted seasonal indices for the four quarters.
b.Find the linear trend equation for the seasonally adjusted quarterly sales.
c.Make the sales forecasts for the first and fourth quarter of Year 8.
(Essay)
4.9/5 (40)
Which of the following models is not called a causal forecasting model?
(Multiple Choice)
4.8/5 (37)
A seasonal component differs from a cyclical component in that the seasonal component ___________.
(Multiple Choice)
4.8/5 (29)
After we have estimated the trend and the seasonal components,we __________ them to make a forecast.
(Essay)
4.7/5 (39)
The exponential smoothing method weighs all available observations in a time series equally.
(True/False)
4.8/5 (37)
Filters
- Essay(0)
- Multiple Choice(0)
- Short Answer(0)
- True False(0)
- Matching(0)