Exam 18: Time Series and Forecasting
Exam 1: Statistics and Data100 Questions
Exam 2: Tabular and Graphical Methods123 Questions
Exam 3: Numerical Descriptive Measures151 Questions
Exam 4: Basic Probability Concepts116 Questions
Exam 5: Discrete Probability Distributions139 Questions
Exam 6: Continuous Probability Distributions128 Questions
Exam 7: Sampling and Sampling Distributions124 Questions
Exam 8: Interval Estimation123 Questions
Exam 9: Hypothesis Testing135 Questions
Exam 10: Statistical Inference Concerning Two Populations124 Questions
Exam 11: Statistical Inference Concerning Variance111 Questions
Exam 12: Chi-Square Tests120 Questions
Exam 13: Analysis of Variance58 Questions
Exam 14: Regression Analysis140 Questions
Exam 15: Inference With Regression Models124 Questions
Exam 16: Regression Models for Nonlinear Relationships115 Questions
Exam 17: Regression Models With Dummy Variables114 Questions
Exam 18: Time Series and Forecasting124 Questions
Exam 19: Returns, Index Numbers and Inflation120 Questions
Exam 20: Nonparametric Tests108 Questions
Select questions type
Noncausal forecasting models are purely time series models in the sense that the forecasts are made based only on historical data concerning the variable of interest.
(True/False)
4.9/5  (29)
(29)
When the forecasting method of seasonal dummy variables is applied on a quarterly time series,four dummy variables are needed.
(True/False)
4.8/5 (44)
Which of the following is a similarity between the exponential smoothing method and the moving average method?
(Multiple Choice)
5.0/5 (38)
Using the decomposition model yt = Tt × St × It ,forecasts are made by _______,where  and
and  represent the estimated trend and the (adjusted)seasonal index for period t,respectively.
(Multiple Choice)
4.8/5 (40)
Quarterly sales of a department store for the last seven years are given in the following table. 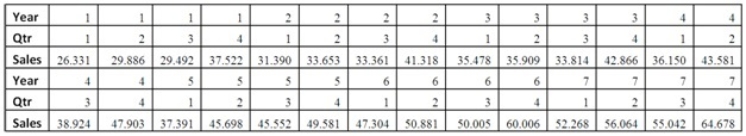
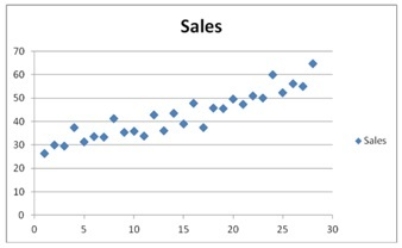 The Excel scatterplot shown indicates that the quarterly sales have an increasing trend and seasonality.Therefore,the linear regression model,Sales = β0 + β1Qtr1 + β2Qtr2 + β3Qtr3 + β4t + ε,with three seasonal dummy variables Qtr1,Qtr2,and Qtr3,and the decomposition method are proposed to make sales forecasts.For the regression model,the following Excel partial output is available.
 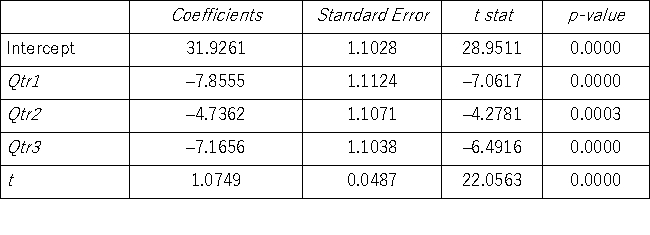 Using the regression equation for the linear trend model with seasonal dummy variables,what is the sales forecast for the fourth quarter of Year 8?
(Essay)
4.9/5 (30)
Which of the following models is considered for a quarterly time series that seems to change on average by a fixed amount and seems to have seasonality?
(Multiple Choice)
4.9/5 (43)
Based on quarterly data collected over the last five years,the following regression equation was found to forecast the quarterly demand for the number of new copies of a business statistics textbook:  = 2,298 - 6635Qtr1 - 1,446Qtr2 + 303Qtr3 + 26t,where Qtr1,Qtr2,and Qtr3 are dummy variables corresponding to Quarters 1,2,and 3,and t = time period. For a given year,the demand in Quarter 3 is on average _________.
(Multiple Choice)
4.7/5 (39)
Although we use the MSE to compare the linear and the exponential trend models,we cannot use it to compare the linear,quadratic,and cubic trend models.
(True/False)
4.9/5 (33)
Which of the following factors refers to quantitative forecasting methods?
(Multiple Choice)
4.7/5 (37)
The moving average method is one of the most complex smoothing techniques used for processing time series.
(True/False)
4.8/5 (39)
Causal forecasting models are based on regression framework,where the variable to be forecast depends on one or more explanatory variables.
(True/False)
4.8/5 (32)
If T denotes the number of observations,which of the following equations represents the one-step-ahead forecast for the model yt = β0 + β1xt + εt?
(Multiple Choice)
4.8/5 (34)
Smoothing techniques are suitable for use when forecasts need to be updated frequently due to new observations that become available.
(True/False)
4.9/5 (34)
Which of the following components does not cause the systematic patterns?
(Multiple Choice)
4.8/5 (40)
When a time series has both trend and seasonality,moving averages can be employed to separate the effect of these two components.
(True/False)
4.9/5 (29)
When a time series is analyzed by the model yt = Tt × St × It ,which of the following is valid?
(Multiple Choice)
4.9/5 (38)
Prices of crude oil have been steadily rising over the last two years (The Wall Street Journal,December 14,2010).The monthly data on price per gallon of unleaded regular gasoline in the United States from January 2009 to December 2010 were available.Three trend models were created,and the following relevant information became available. 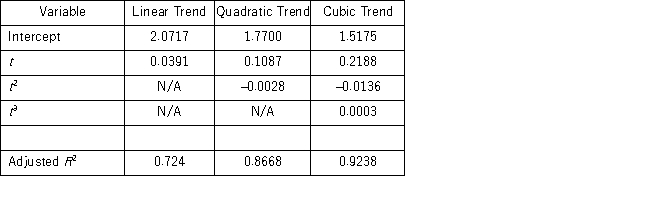 Which of the following is a cubic trend equation used to forecast for the price of regular unleaded gasoline?
(Multiple Choice)
5.0/5 (38)
Filters
- Essay(0)
- Multiple Choice(0)
- Short Answer(0)
- True False(0)
- Matching(0)