Exam 16: Regression Models for Nonlinear Relationships
Exam 1: Statistics and Data100 Questions
Exam 2: Tabular and Graphical Methods123 Questions
Exam 3: Numerical Descriptive Measures151 Questions
Exam 4: Basic Probability Concepts116 Questions
Exam 5: Discrete Probability Distributions139 Questions
Exam 6: Continuous Probability Distributions128 Questions
Exam 7: Sampling and Sampling Distributions124 Questions
Exam 8: Interval Estimation123 Questions
Exam 9: Hypothesis Testing135 Questions
Exam 10: Statistical Inference Concerning Two Populations124 Questions
Exam 11: Statistical Inference Concerning Variance111 Questions
Exam 12: Chi-Square Tests120 Questions
Exam 13: Analysis of Variance58 Questions
Exam 14: Regression Analysis140 Questions
Exam 15: Inference With Regression Models124 Questions
Exam 16: Regression Models for Nonlinear Relationships115 Questions
Exam 17: Regression Models With Dummy Variables114 Questions
Exam 18: Time Series and Forecasting124 Questions
Exam 19: Returns, Index Numbers and Inflation120 Questions
Exam 20: Nonparametric Tests108 Questions
Select questions type
The fit of the models y = β0 + β1x + ε and ln(y)= β0 + β1ln(x)+ ε can be compared using the coefficients R2 found in the two corresponding Excel's regression outputs.
(True/False)
4.8/5  (33)
(33)
For the exponential model ln(y)= β0 + β1x + ε ,if x increases by one unit,then E(y)changes by approximately ____________.
(Multiple Choice)
4.8/5 (39)
It is not very informative to start with developing a scatterplot of the response variable against the explanatory variable.
(True/False)
4.8/5 (26)
When the predicted value of the response variable has to be found,in which of the following two models,is there a need for the standard error correction?
(Multiple Choice)
4.8/5 (31)
For the model ln(y)= β0 + β1ln(x)+ ε with 0 < β1 < 1,if x increases than E(y)increases but at a slower rate.
(True/False)
4.8/5 (30)
In the model ln(y)= β0 + β1 ln(x)+ ε,the coefficient β1 is the approximate ____________________________.
(Multiple Choice)
4.8/5 (30)
In which of the following models does the slope coefficient b1 measure the approximate percentage change in  when x increases by 1%?
(Multiple Choice)
5.0/5 (41)
The scatterplot shown below represents a typical shape of a cubic regression model y = β0 + β1x + β2x2 + β3x3 + ε. 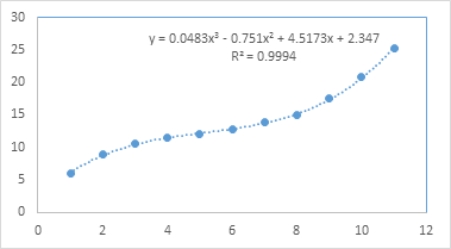 Which of the following is true about values of the regression coefficients?
(Multiple Choice)
4.8/5 (37)
The fit of the models y = β0 + β1x + ε and y = β0 + β1ln(x)+ ε can be compared using the coefficient of determination R2.
(True/False)
4.8/5 (45)
It is believed that the sales volume of one-liter Pepsi bottles depends on the price of the bottle and the price of a one-liter bottle of Coca-Cola.The following data have been collected for a certain sales region.  Using Excel's regression,the linear model Pepsi Sales = β0 + β1Pepsi Price + β2Cola Price + ε and the log-log model ln(Pepsi Sales)= β0 + β1ln(Pepsi Price)+ β2ln(Cola Price)+ ε have been estimated as follows:
  What is the estimated linear regression model?
(Essay)
4.7/5 (32)
It is believed that the sales volume of one-liter Pepsi bottles depends on the price of the bottle and the price of a one-liter bottle of Coca-Cola.The following data have been collected for a certain sales region.  Using Excel's regression,the linear model Pepsi Sales = β0 + β1Pepsi Price + β2Cola Price + ε and the log-log model ln(Pepsi Sales)= β0 + β1ln(Pepsi Price)+ β2ln(Cola Price)+ ε have been estimated as follows:
  What is the percentage of variations in ln(PepsiSales)as explained by the estimated log-log model?
(Essay)
4.9/5 (35)
The following Excel scatterplot with the fitted quadratic regression equation illustrates the observed relationship between productivity and the number of hired workers. 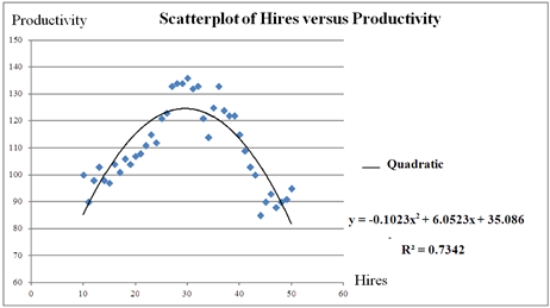 Which of the following is the predicted productivity when 32 workers are hired?
(Multiple Choice)
4.8/5 (31)
It is believed that the sales volume of one-liter Pepsi bottles depends on the price of the bottle and the price of a one-liter bottle of Coca-Cola.The following data have been collected for a certain sales region. 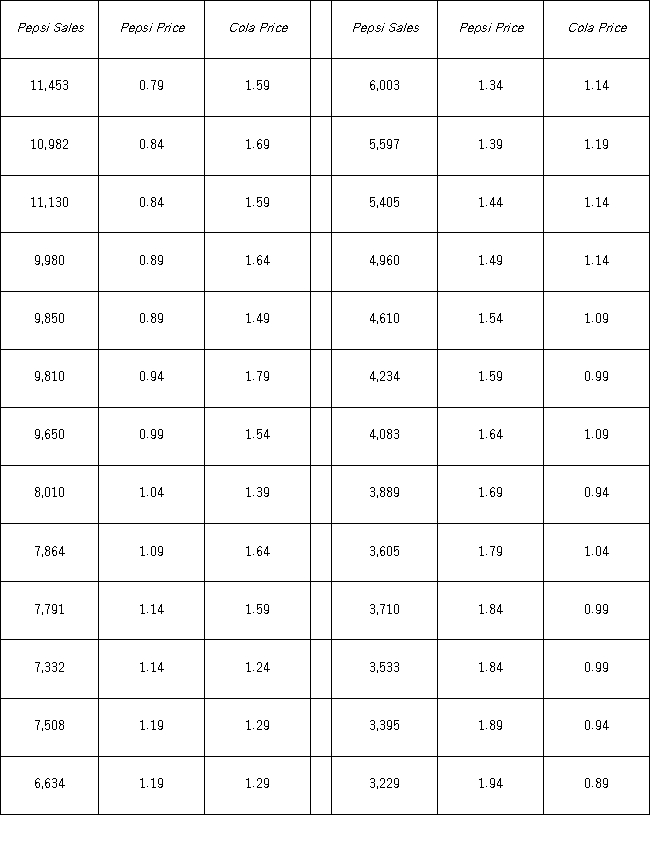 Using Excel's regression,the linear model Pepsi Sales = β0 + β1Pepsi Price + β2Cola Price + ε and the log-log model ln(Pepsi Sales)= β0 + β1ln(Pepsi Price)+ β2ln(Cola Price)+ ε have been estimated as follows:
 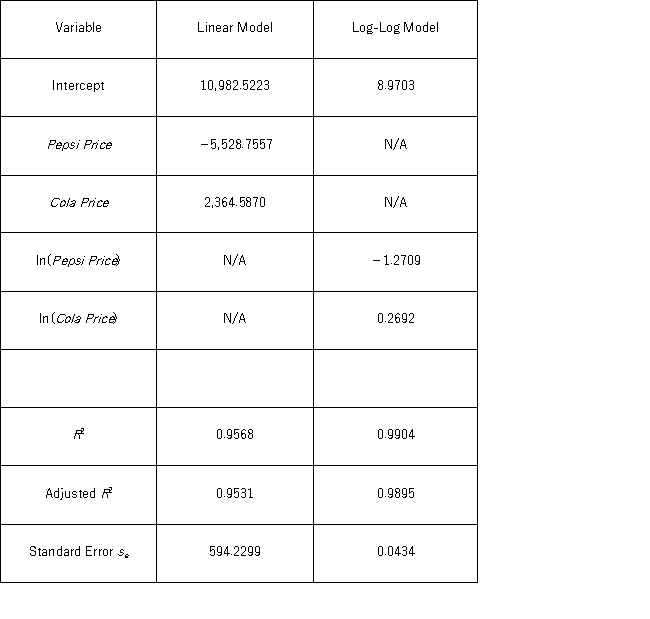 What is the estimated log-log regression model?
(Essay)
4.9/5 (35)
Which of the following is not a semi-log regression model?
(Multiple Choice)
4.8/5 (30)
The quadratic regression model is appropriate when the slope,capturing the influence of x on y,changes in magnitude as well as sign.
(True/False)
4.9/5 (39)
Filters
- Essay(0)
- Multiple Choice(0)
- Short Answer(0)
- True False(0)
- Matching(0)