Exam 16: Regression Models for Nonlinear Relationships
Exam 1: Statistics and Data100 Questions
Exam 2: Tabular and Graphical Methods123 Questions
Exam 3: Numerical Descriptive Measures151 Questions
Exam 4: Basic Probability Concepts116 Questions
Exam 5: Discrete Probability Distributions139 Questions
Exam 6: Continuous Probability Distributions128 Questions
Exam 7: Sampling and Sampling Distributions124 Questions
Exam 8: Interval Estimation123 Questions
Exam 9: Hypothesis Testing135 Questions
Exam 10: Statistical Inference Concerning Two Populations124 Questions
Exam 11: Statistical Inference Concerning Variance111 Questions
Exam 12: Chi-Square Tests120 Questions
Exam 13: Analysis of Variance58 Questions
Exam 14: Regression Analysis140 Questions
Exam 15: Inference With Regression Models124 Questions
Exam 16: Regression Models for Nonlinear Relationships115 Questions
Exam 17: Regression Models With Dummy Variables114 Questions
Exam 18: Time Series and Forecasting124 Questions
Exam 19: Returns, Index Numbers and Inflation120 Questions
Exam 20: Nonparametric Tests108 Questions
Select questions type
The following Excel scatterplot with the fitted quadratic regression equation illustrates the observed relationship between productivity and the number of hired workers.  Assuming that the number of hired workers must be an integer,what is the maximum productivity to achieve?
(Multiple Choice)
4.8/5  (38)
(38)
Which of the following regression models is most likely to provide the best fit for the data represented by the following scatterplot? 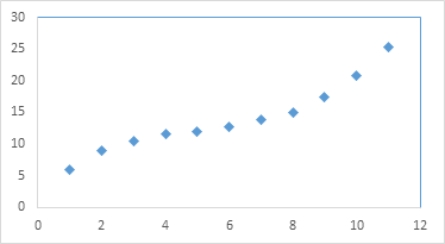
(Multiple Choice)
4.7/5 (32)
The following data show the demand for an airline ticket dependent on the price of this ticket. 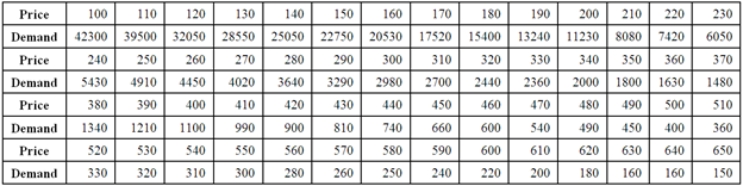 For the assumed cubic and log-log regression models,Demand = β0 + β1Price + β2Price2 + β3Price3 + ε and ln(Demand)= β0 + β1ln(Price)+ ε,the following regression results are available.
 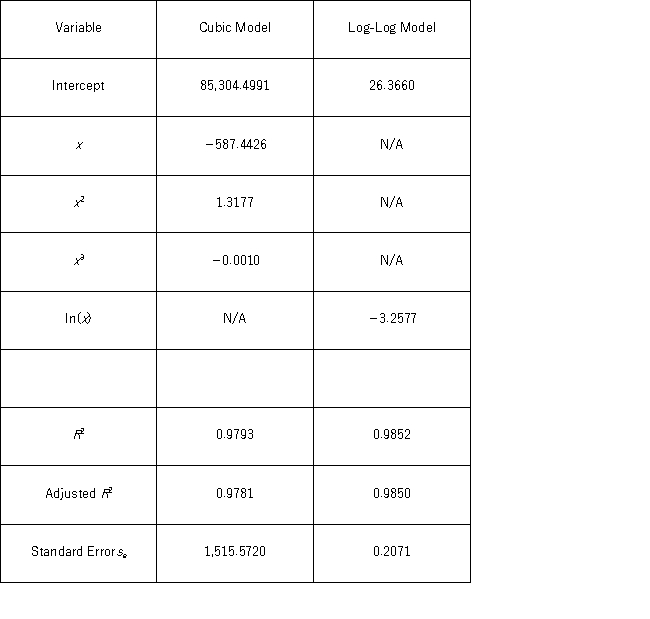 Assuming that the sample correlation coefficient between Demand and
  = exp(26.3660 - 3.2577 ln(Price)+ (0.2071)2/2)is 0.956,what is the percentage of variations in Demand explained by the log-log regression equation?
(Multiple Choice)
4.8/5 (34)
The logarithmic model is especially attractive when only the ____________ variable is better captured in percentages.
(Essay)
4.8/5 (35)
A quadratic regression model is a special type of a polynomial regression model.
(True/False)
4.9/5 (35)
The quadratic and logarithmic models,y = β0 + β1x + β2x2 + ε and y = β0 + β1 ln(x)+ ε,were used to fit given data on y and x,and the following table summarizes the regression results.Which of the two models provides a better fit? 
(Multiple Choice)
4.7/5 (36)
For the log-log model ln(y)= β0 + β1ln(x)+ ε,the predicted value of y is computed by ________________.
(Multiple Choice)
4.8/5 (37)
Typically,the sales volume declines with an increase of a product price.It has been observed,however,that for some luxury goods the sales volume may increase when the price increases.The following Excel output illustrates this rather unusual relationship. 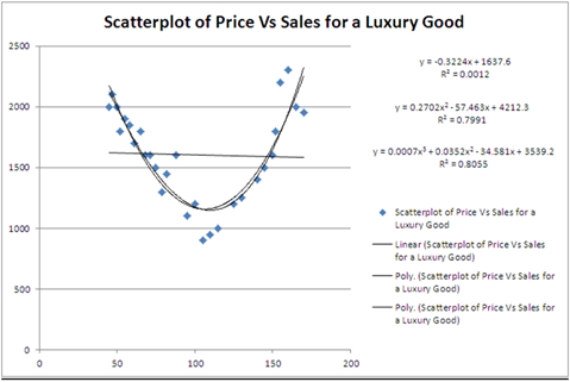 For which of the following prices do sales predicted by the quadratic regression equation reach their minimum?
(Multiple Choice)
4.8/5 (35)
The fit of the models y = β0 + β1x + β2x2+ ε and y = β0 + β1ln(x)+ ε can be compared using the coefficient of determination R2.
(True/False)
4.9/5 (38)
The following Excel scatterplot with the fitted quadratic regression equation illustrates the observed relationship between productivity and the number of hired workers.  Assuming that the values of Hires can be nonintegers,what is the maximum value of Productivity?
(Multiple Choice)
4.8/5 (36)
Thirty employed single individuals were randomly selected to examine the relationship between their age (Age)and their credit card debt (Debt)expressed as a percentage of their annual income.Three polynomial models were applied and the following table summarizes Excel's regression results.  Using the quadratic regression equation,find the predicted maximum percentage debt.
(Essay)
4.8/5 (38)
The log-log and exponential models,ln(x)= β0 + β1ln(x)+ ε and (y)= β0 + β1x + ε,were used to fit given data on y and x,and the following table summarizes the regression results.Which of the two models provides a better fit? 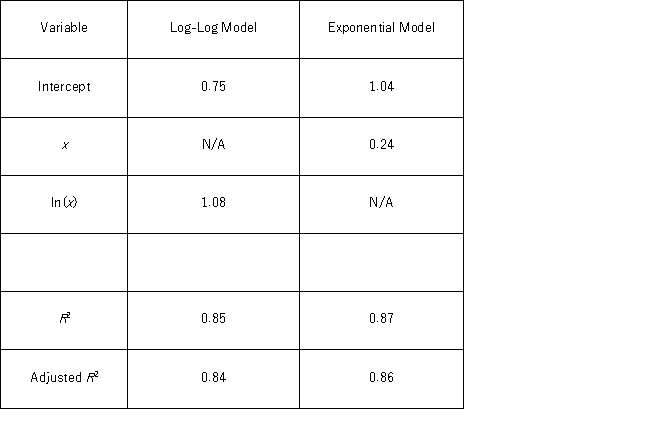
(Multiple Choice)
4.8/5 (36)
The following data,with the corresponding Excel scatterplot,show the average growth rate of Weeping Higan cherry trees planted in Washington,DC.At the time of planting,the trees were one year old and were all six feet in height. 
 If a cherry tree is planted as a one-year-old and six-foot-tall tree,which of the following is the estimated time needed by the tree to reach 16.5 feet in height?
(Multiple Choice)
4.8/5 (34)
The following Excel scatterplot with the fitted quadratic regression equation illustrates the observed relationship between productivity and the number of hired workers. 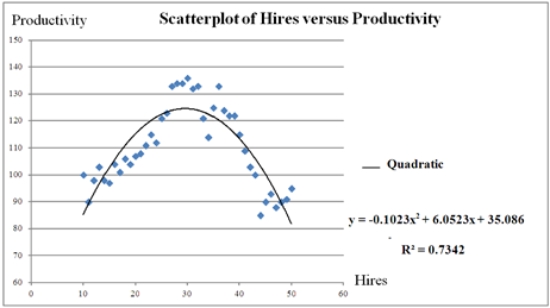 Assuming that the number of hired workers must be integer,how many workers should be hired to achieve the highest productivity?
(Multiple Choice)
4.9/5 (28)
The following data,with the corresponding Excel scatterplot,show the average growth rate of Weeping Higan cherry trees planted in Washington,DC.At the time of planting,the trees were one year old and were all six feet in height. 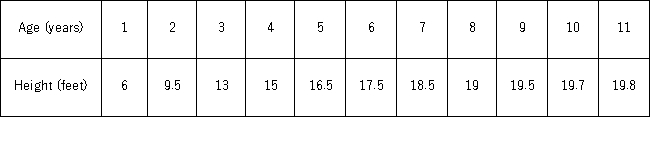
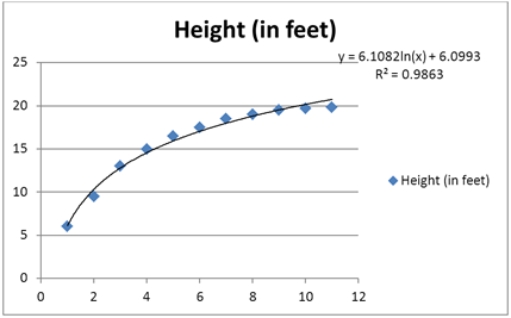 The 98.63% of the variations in Height is explained by _______.
(Multiple Choice)
4.9/5 (40)
Which of the following nonlinear regression models is the polynomial regression model of order three?
(Multiple Choice)
4.8/5 (37)
Thirty employed single individuals were randomly selected to examine the relationship between their age (Age)and their credit card debt (Debt)expressed as a percentage of their annual income.Three polynomial models were applied and the following table summarizes Excel's regression results. 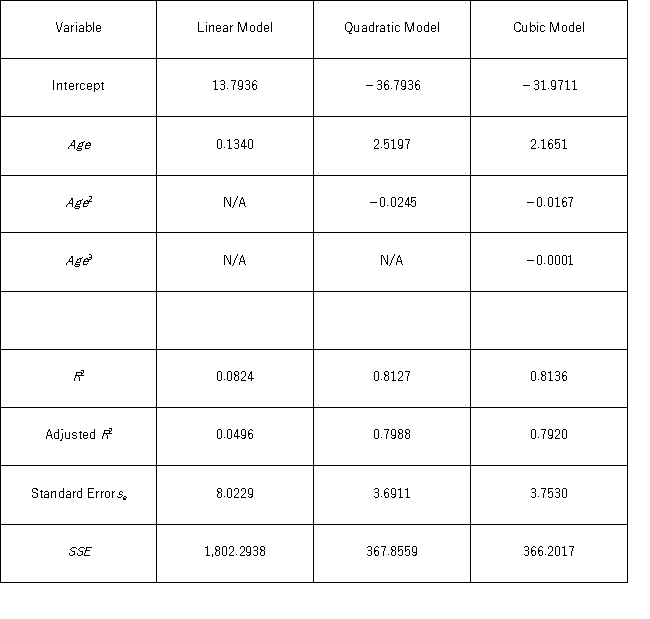 What is the percentage of variations in Debt explained by Age in the regression equation with the best fit?
(Essay)
4.8/5 (32)
Filters
- Essay(0)
- Multiple Choice(0)
- Short Answer(0)
- True False(0)
- Matching(0)