Exam 11: Multiple Regression
Exam 1: Looking at Datadistributions127 Questions
Exam 2: Looking at Datarelationships48 Questions
Exam 3: Producing Data70 Questions
Exam 4: Probability: the Study of Randomness93 Questions
Exam 5: Sampling Distributions77 Questions
Exam 6: Introduction to Inference89 Questions
Exam 7: Inference for Means103 Questions
Exam 8: Inference for Proportions101 Questions
Exam 9: Inference for Categorical Data122 Questions
Exam 10: Inference for Regression91 Questions
Exam 11: Multiple Regression95 Questions
Exam 12: One-Way Analysis of Variance74 Questions
Exam 13: Two-Way Analysis of Variance53 Questions
Exam 14: Logistic Regression53 Questions
Exam 15: Nonparametric Tests57 Questions
Exam 16: Bootstrap Methods and Permutation Tests42 Questions
Exam 17: Statistics for Quality: Control and Capability86 Questions
Select questions type
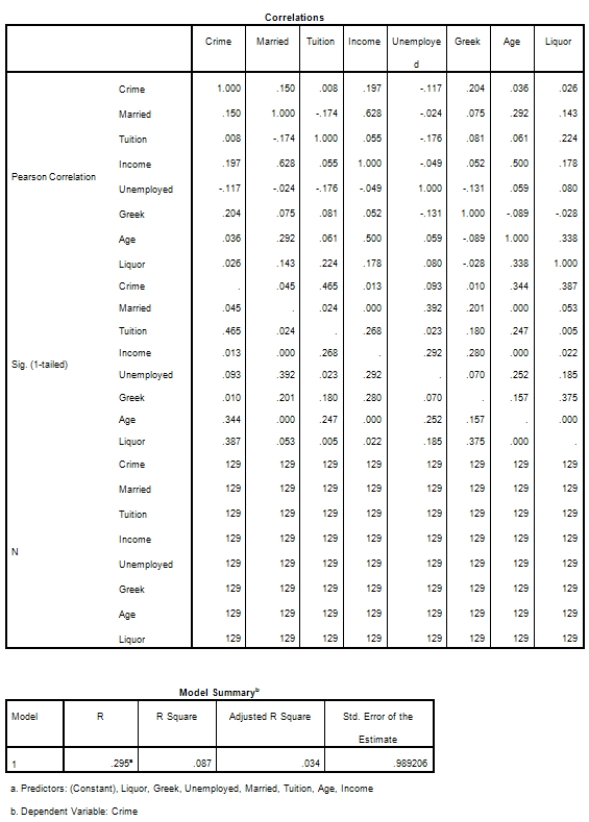
Campus crime rates are generally lower than the national average;however thousands of crimes take place on college campuses daily.Cities that are notoriously dangerous would likely be undesirable locations for a college campus.A study examined the crime rates on campuses throughout the United States and whether or not they were significantly affected by surrounding cities.A regression analysis was performed to investigate which characteristics of a city,along with a few chosen demographics of a school,impacted the crime rate on a college campus.There are over 4000 colleges and universities in the United States.The study included a random sample of 129 institutions.The response variable was the number of crimes per 1000 people.Explanatory variables included the percent of married couples in the city (married),tuition of the university (tuition),average income of the city (income),unemployment rate of the city (unemployment),percent of students who belong to a fraternity or sorority (Greek),average age of the students at the university (age),and number of liquor stores in the city (liquor).A complete analysis of the data is shown below. 


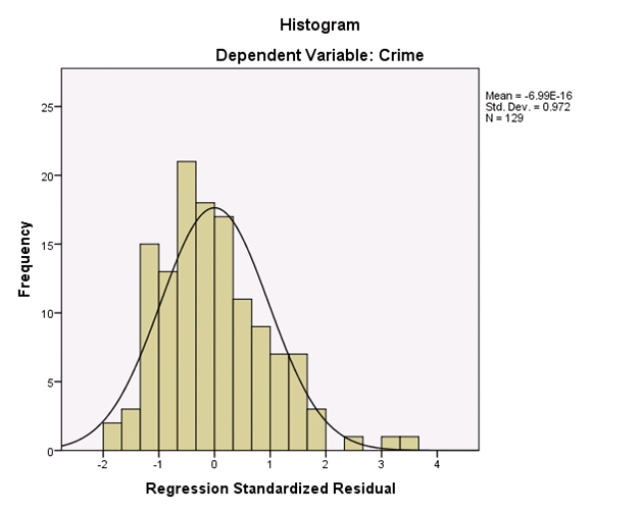
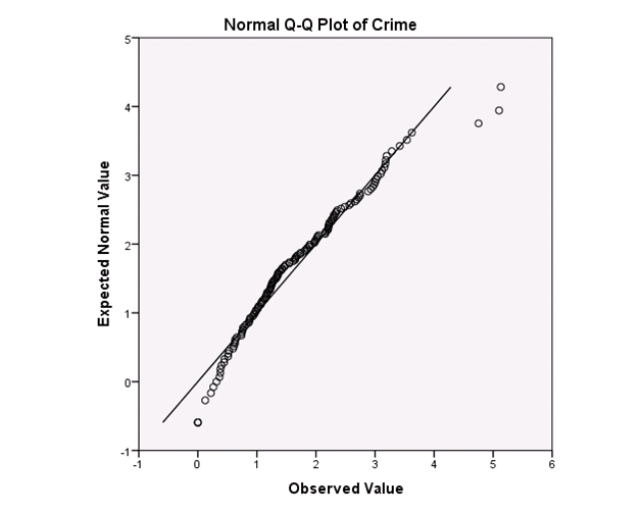
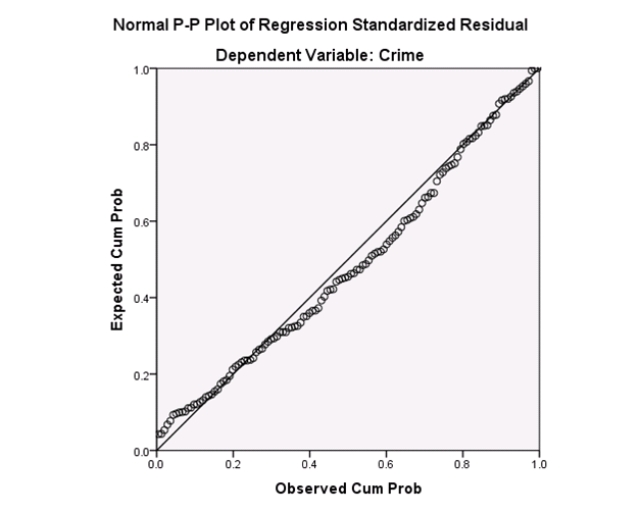 Preliminary analysis indicated that the independent variable,Greek,was clearly not normal and skewed left.Will this cause any problems with the results of the regression analysis?
Free
(Multiple Choice)
5.0/5  (33)
(33)
Correct Answer: Verified
C
Campus crime rates are generally lower than the national average;however thousands of crimes take place on college campuses daily.Cities that are notoriously dangerous would likely be undesirable locations for a college campus.A study examined the crime rates on campuses throughout the United States and whether or not they were significantly affected by surrounding cities.A regression analysis was performed to investigate which characteristics of a city,along with a few chosen demographics of a school,impacted the crime rate on a college campus.There are over 4000 colleges and universities in the United States.The study included a random sample of 129 institutions.The response variable was the number of crimes per 1000 people.Explanatory variables included the percent of married couples in the city (married),tuition of the university (tuition),average income of the city (income),unemployment rate of the city (unemployment),percent of students who belong to a fraternity or sorority (Greek),average age of the students at the university (age),and number of liquor stores in the city (liquor).A complete analysis of the data is shown below. 


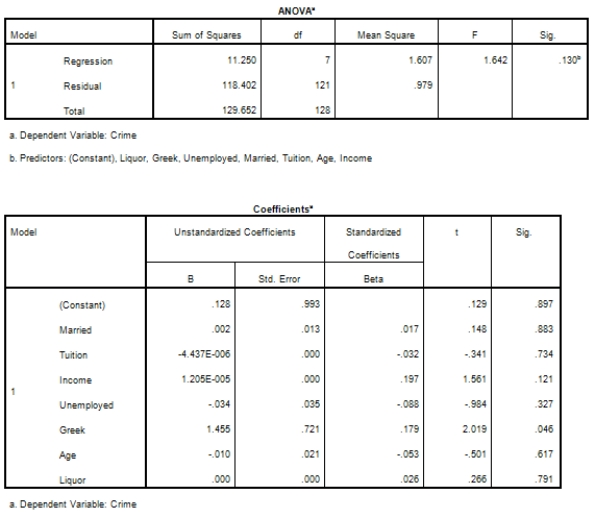

 The ANOVA F statistic is 1.642 with a P-value of .130.What does this tell us about the regression coefficients for the explanatory variables?
Free
(Multiple Choice)
4.8/5 (39)
Correct Answer:Verified
C
In multiple regression,what does the parameter 2 measure?
Free
(Multiple Choice)
4.7/5 (33)
Correct Answer:Verified
A
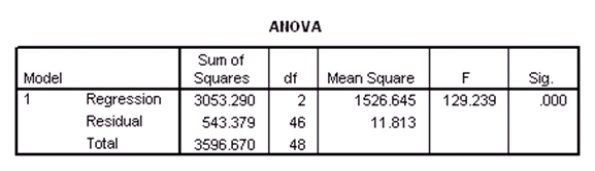
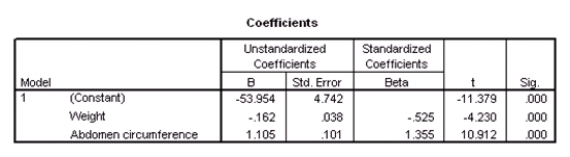
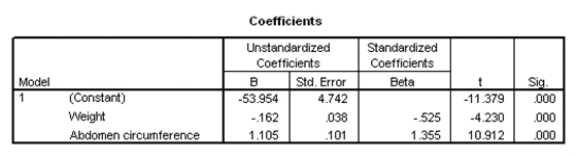
Researchers at a large nutrition and weight management company are trying to build a model to predict a person's body fat percentage from an array of variables such as body weight,height,and body measurements around the neck,chest,abdomen,hips,biceps,etc.A variable selection method is used to build a simple model.SPSS output for the final model is given below. 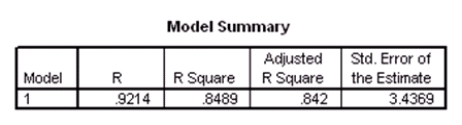
 A graph of the residuals versus the predicted values is given below.
 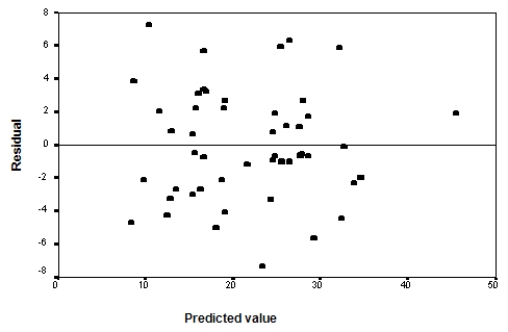 What assumption do we check with this graph?
(Multiple Choice)
4.8/5 (32)
The NFL keeps track of a large number of statistics during the football season.For 2009 the number of points scored per game and how it related to such variables as the number of passes attempted per game (PassAtt/G),the total pass yards gained during the season (PassYds),and the total rushing yards gained in the season (RushYds)were studied.The following tables provide information on the least-squares fit of a multiple regression model for Pts/G on the three explanatory variables. 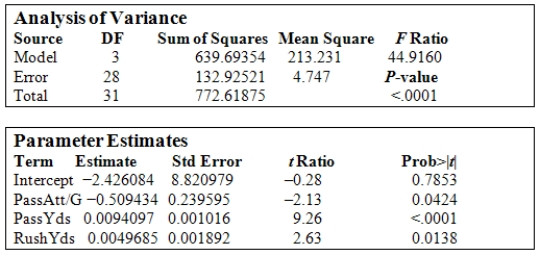 What would be the 96% confidence interval estimate for the true regression coefficient for the variable PassAtt/G?
(Multiple Choice)
4.8/5 (28)
The variable mood takes on the values 1 for "happy mood" and 0 for "bad mood." Is this an indicator variable?
(Multiple Choice)
4.9/5 (36)
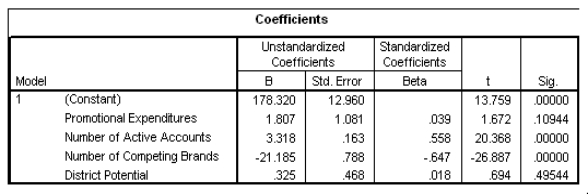
The data referred to in this question were collected from several sales districts across the country.The data represent sales for a maker of asphalt roofing shingles.Information on the following variables is available.  Partial SPSS regression output of a multiple regression model with sales as the response variable and the other four variables as predictor variables are given below.
 An F test for the two coefficients of promotional expenditures and district potential is performed.The hypotheses are H0: 1 = 4 = 0 versus Ha: at least one of the j is not 0.The F statistic for this test is 1.482 with 2 and 21 degrees of freedom.What can we say about the P-value for this test?
(Multiple Choice)
4.8/5 (28)
A researcher is investigating possible explanations for deaths in traffic accidents.He examined data from 1991 for each of the 50 states plus Washington,DC.The data included information on the following variables.  As part of his investigation he ran the multiple regression model, Deaths = 0 + 1(Children)+ 2(Income)+ i,
Where the deviations i were assumed to be independent and Normally distributed with a mean of 0 and a standard deviation of .This model was fit to the data using the method of least squares.The following results were obtained from statistical software.
As part of his investigation he ran the multiple regression model, Deaths = 0 + 1(Children)+ 2(Income)+ i,
Where the deviations i were assumed to be independent and Normally distributed with a mean of 0 and a standard deviation of .This model was fit to the data using the method of least squares.The following results were obtained from statistical software. 
 Suppose we wish to test the hypotheses H0: 1 = 2 = 0 versus Ha: at least one of the j is not 0 using the ANOVA F test.What can we say about the P-value for the ANOVA F test?
(Multiple Choice)
4.8/5 (29)
The NFL keeps track of a large number of statistics during the football season.For 2009 the number of points scored per game and how it related to such variables as the number of passes attempted per game (PassAtt/G),the total pass yards gained during the season (PassYds),and the total rushing yards gained in the season (RushYds)were studied.The following tables provide information on the least-squares fit of a multiple regression model for Pts/G on the three explanatory variables.  If a team were to attempt 30 passes per game,pass for a total of 3500 yards,and rush for 2000 yards,what would the fitted regression model predict for the points the team would score per game?
(Multiple Choice)
4.8/5 (32)
Campus crime rates are generally lower than the national average;however thousands of crimes take place on college campuses daily.Cities that are notoriously dangerous would likely be undesirable locations for a college campus.A study examined the crime rates on campuses throughout the United States and whether or not they were significantly affected by surrounding cities.A regression analysis was performed to investigate which characteristics of a city,along with a few chosen demographics of a school,impacted the crime rate on a college campus.There are over 4000 colleges and universities in the United States.The study included a random sample of 129 institutions.The response variable was the number of crimes per 1000 people.Explanatory variables included the percent of married couples in the city (married),tuition of the university (tuition),average income of the city (income),unemployment rate of the city (unemployment),percent of students who belong to a fraternity or sorority (Greek),average age of the students at the university (age),and number of liquor stores in the city (liquor).A complete analysis of the data is shown below. 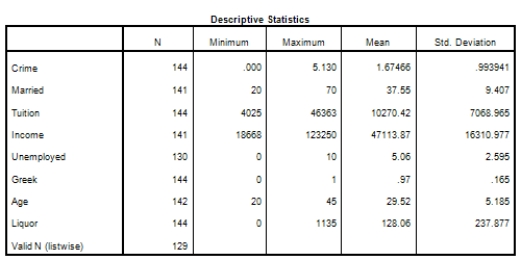


 What should be done to examine the relationship between every pair of variables more closely?
(Multiple Choice)
4.8/5 (43)
In multiple regression,a small P-value from the ANOVA F test indicates that all the regression coefficients for the explanatory variables are different from zero.
(Multiple Choice)
4.9/5 (27)
A study was conducted on 40 different brands of golf balls with respect to the distance the ball traveled after being struck with standardized test 7-iron.The response variable DIST is the measurement of the carry distance of the shot in yards.The explanatory variables are SMASH,the ratio of the ball speed/club speed at impact;SPIN,the initial spin rate of the ball in RPMs;and HEIGHT,the peak height of the ball in flight measured in feet. The following is a table showing some computer output (missing results are shown by **)for a least-squares fit of a multiple regression model using these variables. 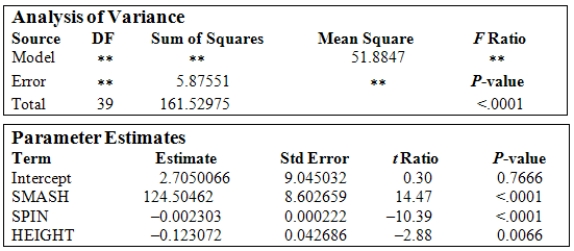 What is the estimate of the parameter
  ?
?
(Multiple Choice)
4.9/5 (25)
The data referred to in this question were collected from several sales districts across the country.The data represent sales for a maker of asphalt roofing shingles.Information on the following variables is available. 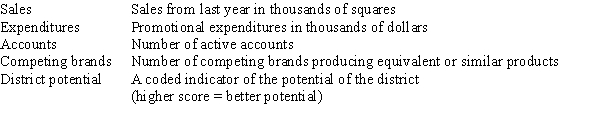 Partial SPSS regression output of a multiple regression model with sales as the response variable and the other four variables as predictor variables are given below.
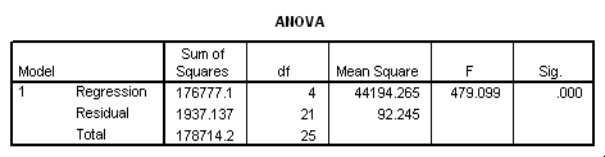
 What is a 95% confidence interval for the coefficient of promotional expenditures?
(Multiple Choice)
4.8/5 (32)
In a multiple regression with three explanatory variables,the total sum of squares SST = 1008,the model mean square MSM = 76,and the test statistic F = 2.533.How many observations were used?
(Multiple Choice)
4.7/5 (26)
In this experiment,the risk-taking propensity of 90 inner city drug users was measured using a repeated measures test called the Behavioral Analogue Risk Task (BART;Lejuez et al. ,2002).The higher the BART score,the higher the risk-taking propensity.Participants also filled out questionnaires so that their Psychopathic Personality Inventory (PPI)scores could be computed.PPI scores are used to detect psychopathic traits in a covert manner and are a common indicator of one's level of psychopathy.The main goal of the experiment was to examine the relationship between risk-taking (measured by BART)based on one's level of psychopathy (measured by PPI on a scale of 0-100),gender (1 for male and 2 for female),and heroin use (1 for heroin use and 0 for no heroin use).Below is a partial output of a multiple regression analysis.  What proportion of the variation of the response variable is explained by the explanatory variables?
(Multiple Choice)
4.9/5 (32)
A multiple linear regression model can be described by DATA = FIT + RESIDUAL.What does the RESIDUAL part represent?
(Multiple Choice)
4.8/5 (41)
The data referred to in this question were collected from several sales districts across the country.The data represent sales for a maker of asphalt roofing shingles.Information on the following variables is available. 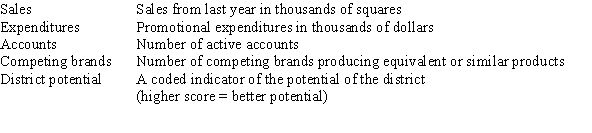 Partial SPSS regression output of a multiple regression model with sales as the response variable and the other four variables as predictor variables are given below.
 In an attempt to increase sales,the company can only directly influence some of these variables.It cannot change the number of competitors;it cannot change the district potential.The only two variables they can actively change are the number of active accounts and the promotional expenditures.Suppose they have $5000 to spend on new commercials (that is,promotional expenditures).By how much are sales expected to increase?
(Multiple Choice)
4.9/5 (34)
Researchers at a large nutrition and weight management company are trying to build a model to predict a person's body fat percentage from an array of variables such as body weight,height,and body measurements around the neck,chest,abdomen,hips,biceps,etc.A variable selection method is used to build a simple model.SPSS output for the final model is given below. 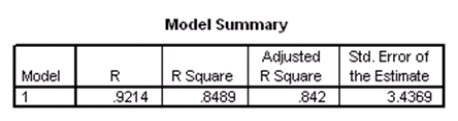
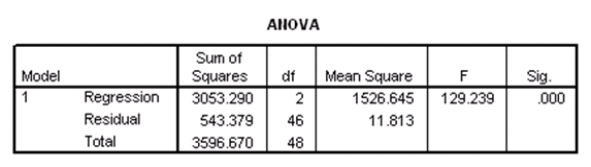
 How many people were included in the study?
(Multiple Choice)
4.9/5 (39)
In this experiment,the risk-taking propensity of 90 inner city drug users was measured using a repeated measures test called the Behavioral Analogue Risk Task (BART;Lejuez et al. ,2002).The higher the BART score,the higher the risk-taking propensity.Participants also filled out questionnaires so that their Psychopathic Personality Inventory (PPI)scores could be computed.PPI scores are used to detect psychopathic traits in a covert manner and are a common indicator of one's level of psychopathy.The main goal of the experiment was to examine the relationship between risk-taking (measured by BART)based on one's level of psychopathy (measured by PPI on a scale of 0-100),gender (1 for male and 2 for female),and heroin use (1 for heroin use and 0 for no heroin use).Below is a partial output of a multiple regression analysis.  Does this model seem like an adequate model to predict risk-taking propensity?
(Multiple Choice)
4.8/5 (35)
In this experiment,the risk-taking propensity of 90 inner city drug users was measured using a repeated measures test called the Behavioral Analogue Risk Task (BART;Lejuez et al. ,2002).The higher the BART score,the higher the risk-taking propensity.Participants also filled out questionnaires so that their Psychopathic Personality Inventory (PPI)scores could be computed.PPI scores are used to detect psychopathic traits in a covert manner and are a common indicator of one's level of psychopathy.The main goal of the experiment was to examine the relationship between risk-taking (measured by BART)based on one's level of psychopathy (measured by PPI on a scale of 0-100),gender (1 for male and 2 for female),and heroin use (1 for heroin use and 0 for no heroin use).Below is a partial output of a multiple regression analysis.  What are the explanatory variables in this study?
(Multiple Choice)
4.7/5 (41)
Filters
- Essay(0)
- Multiple Choice(0)
- Short Answer(0)
- True False(0)
- Matching(0)