Exam 2: Looking at Datarelationships
Exam 1: Looking at Datadistributions127 Questions
Exam 2: Looking at Datarelationships48 Questions
Exam 3: Producing Data70 Questions
Exam 4: Probability: the Study of Randomness93 Questions
Exam 5: Sampling Distributions77 Questions
Exam 6: Introduction to Inference89 Questions
Exam 7: Inference for Means103 Questions
Exam 8: Inference for Proportions101 Questions
Exam 9: Inference for Categorical Data122 Questions
Exam 10: Inference for Regression91 Questions
Exam 11: Multiple Regression95 Questions
Exam 12: One-Way Analysis of Variance74 Questions
Exam 13: Two-Way Analysis of Variance53 Questions
Exam 14: Logistic Regression53 Questions
Exam 15: Nonparametric Tests57 Questions
Exam 16: Bootstrap Methods and Permutation Tests42 Questions
Exam 17: Statistics for Quality: Control and Capability86 Questions
Select questions type
A categorical variable can be added to a scatterplot.
Free
(True/False)
4.8/5  (37)
(37)
Correct Answer: Verified
True
Malaria is a leading cause of infectious disease and death worldwide.It is also a popular example of a vector-borne disease that could be greatly affected by the influence of climate change.The scatterplot shows total precipitation (in mm)in select cities in West Africa on the x axis and the percent of people who tested positive for malaria in the select cities on the y axis in 2000. 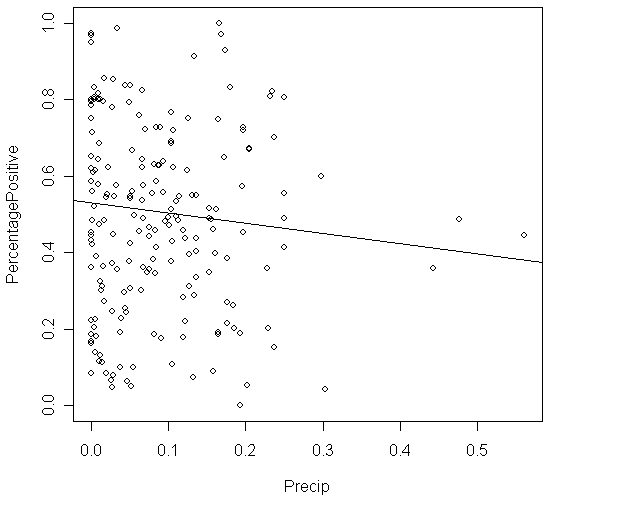 There is a strong linear relationship between percentage of people who tested positive for malaria and precipitation.
Free
(True/False)
4.9/5 (35)
Correct Answer:Verified
False
Fill in the blank.A study is conducted to determine if one can predict the yield of a crop based on the amount of yearly rainfall.The variable _______________ is the response variable in this study.
Free
(Short Answer)
4.7/5 (33)
Correct Answer:Verified
yield of the crop
The scatterplot below displays data collected from 20 adults on their age and overall GPA at graduation. 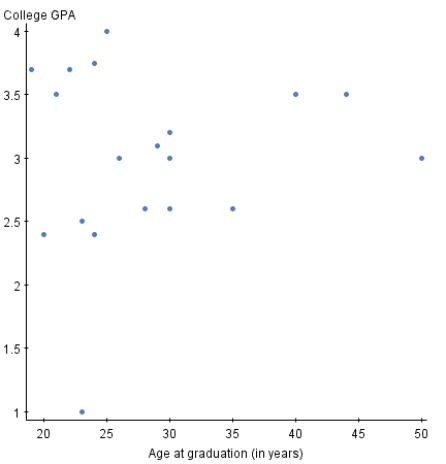 If you switched the variables on the x and y axis,the relationship between the two variables would appear much stronger.
(True/False)
4.8/5 (35)
Volunteers for a research study were divided into three groups.Group 1 listened to Western religious music,Group 2 listened to Western rock music,and Group 3 listened to Chinese religious music.The blood pressure of each volunteer was measured before and after listening to the music,and the change in blood pressure (blood pressure before listening minus blood pressure after listening)was recorded. A scatterplot of change in blood pressure (mmHg)versus the type of music listened to is given below: 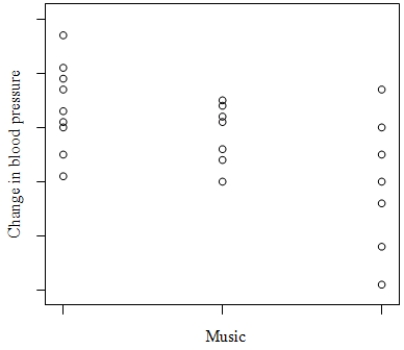 What do we know about the correlation between change in blood pressure and type of music?
(Multiple Choice)
4.8/5 (37)
We are interested in determining if students who graduate from larger universities receive greater starting salaries than students who graduate from smaller universities.We collected data from 50 small universities and 50 large universities to examine this relationship.This is an example of ________
(Multiple Choice)
4.9/5 (37)
Fill in the blank.A researcher is interested in determining if one could predict the score on a statistics exam from the amount of time spent studying for the exam.The variable _______________ is the explanatory variable in this study.
(Short Answer)
4.9/5 (38)
To examine the relationship between two variables,the variables must be measured from the same _______.
(Multiple Choice)
4.9/5 (37)
Variables measured on the same cases are _______ if knowing the values of one of the variables gives you information about the values of another variable that was not known beforehand.
(Multiple Choice)
4.9/5 (38)
Scatterplot "smoothing" is used to determine the ______ of the data.
(Multiple Choice)
4.9/5 (33)
If you have two quantitative variables,one way to study them is to use a ______.
(Multiple Choice)
4.7/5 (35)
Fill in the blank.When creating a scatterplot,one should use the _______________ axis for the explanatory variable if a regression line is to be fit to the data.
(Short Answer)
4.7/5 (28)
Fill in the blank.A scatterplot is a graphical tool for displaying the relationship between two __________ variables measured on the same individuals.
(Short Answer)
4.7/5 (27)
Malaria is a leading cause of infectious disease and death worldwide.It is also a popular example of a vector-borne disease that could be greatly affected by the influence of climate change.The table below is a summary from a linear regression that uses dewpoint (°C)to predict malaria prevalence in West Africa.  There is a negative association between dewpoint and malaria prevalence in West Africa.
(True/False)
4.8/5 (36)
Malaria is a leading cause of infectious disease and death worldwide.It is also a popular example of a vector-borne disease that could be greatly affected by the influence of climate change.The table below is a summary from a linear regression that uses dewpoint (°C)to predict malaria prevalence in West Africa. 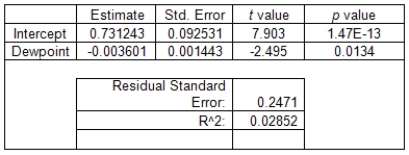 Fill in the blank.The equation of the least-square regression line is __________.
(Short Answer)
4.9/5 (39)
A researcher measured the height (in feet)and volume of usable lumber (in cubic feet)of 32 cherry trees.The goal is to determine if the volume of usable lumber can be estimated from the height of a tree.The results are plotted below: 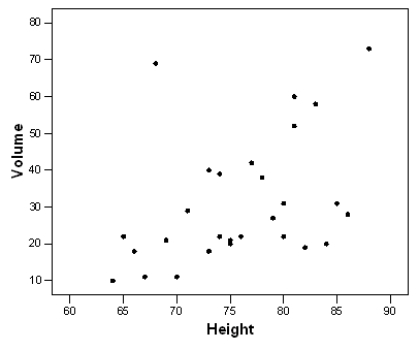 Fill in the blank.The variable _______________ is the response variable in this study.
(Short Answer)
4.7/5 (35)
Scatterplots can be used to explain the relationship between one categorical variable and one quantitative variable.
(True/False)
4.8/5 (28)
Filters
- Essay(0)
- Multiple Choice(0)
- Short Answer(0)
- True False(0)
- Matching(0)