Exam 1: Looking at Datadistributions
Exam 1: Looking at Datadistributions127 Questions
Exam 2: Looking at Datarelationships48 Questions
Exam 3: Producing Data70 Questions
Exam 4: Probability: the Study of Randomness93 Questions
Exam 5: Sampling Distributions77 Questions
Exam 6: Introduction to Inference89 Questions
Exam 7: Inference for Means103 Questions
Exam 8: Inference for Proportions101 Questions
Exam 9: Inference for Categorical Data122 Questions
Exam 10: Inference for Regression91 Questions
Exam 11: Multiple Regression95 Questions
Exam 12: One-Way Analysis of Variance74 Questions
Exam 13: Two-Way Analysis of Variance53 Questions
Exam 14: Logistic Regression53 Questions
Exam 15: Nonparametric Tests57 Questions
Exam 16: Bootstrap Methods and Permutation Tests42 Questions
Exam 17: Statistics for Quality: Control and Capability86 Questions
Select questions type
The World Malaria Report (2008)has information on the number of reported malaria cases from 2005 and 2006 for the 10 countries listed in West Africa.The data are presented in the table below.  The mean number of malaria cases in 2006 is probably ______.
Free
(Multiple Choice)
4.8/5  (27)
(27)
Correct Answer: Verified
A
Suppose you are interested in comparing the quality of different hospitals based on infections occurred from surgery.What would be the best way to measure such a variable?
Free
(Multiple Choice)
4.8/5 (35)
Correct Answer:Verified
A
The Insurance Institute for Highway Safety publishes data on the total damage suffered by compact automobiles in a series of controlled,low-speed collisions.The cost for a sample of nine cars,in hundreds of dollars,is provided below
 What is the first quartile for the above data?
Free
(Multiple Choice)
4.9/5 (37)
Correct Answer:Verified
D
The Insurance Institute for Highway Safety publishes data on the total damage suffered by compact automobiles in a series of controlled,low-speed collisions.The cost for a sample of nine cars,in hundreds of dollars,is provided below
Using the correct units,what is the value of the variance?
(Multiple Choice)
4.9/5 (37)
This is a standard deviation contest.Which of the following sets of four numbers has the largest possible standard deviation?
(Multiple Choice)
4.9/5 (40)
The World Malaria Report (2008)has information on the number of reported malaria cases from 2005 and 2006 for the 10 countries listed in West Africa.The data are presented in the table below. 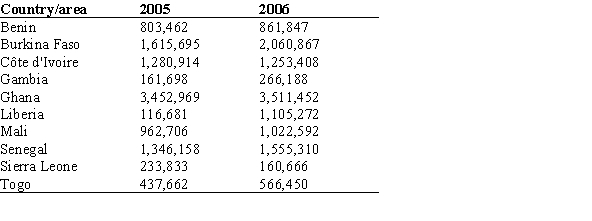 If the number of reported malaria cases in Sierra Leone were mistyped and reported as 1,160,666,what would happen to the mean and median?
(Multiple Choice)
4.8/5 (40)
A consumer agency is testing appliances for a series of articles in their magazine.Currently they are working with cooktops and ranges.They have selected 16 of the most commonly used models.Using a series of tests,the agency will estimate the lifetime of these models.A histogram of these (estimated)lifetimes is shown below. 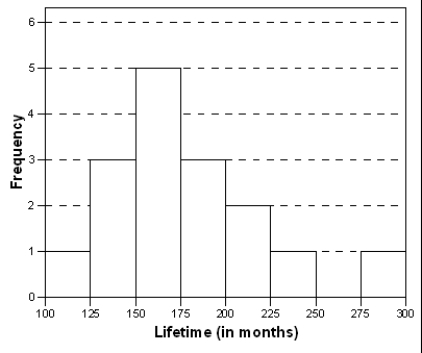 What is the proportion of these appliances that is estimated to last longer than 15 years?
(Multiple Choice)
4.8/5 (27)
The World Malaria Report (2008)has information on the number of reported malaria cases from 2005 and 2006 for the 10 countries listed in West Africa.The data are presented in the table below.  The mean reported malaria cases in 2006 is _________.
(Multiple Choice)
4.9/5 (33)
The Environmental Protection Agency records data on the fuel economy of many different makes of cars.Data on the mileage of 20 randomly selected cars are listed below.The values are ordered for convenience.  If the value 29 were misrecorded and should really be 21,what would the median mileage be for these 20 cars?
(Multiple Choice)
4.8/5 (40)
The timeplot below gives the number of burglaries committed each month for a city in Ohio.The plot is for the three-year period of January 1987 to December 1989. 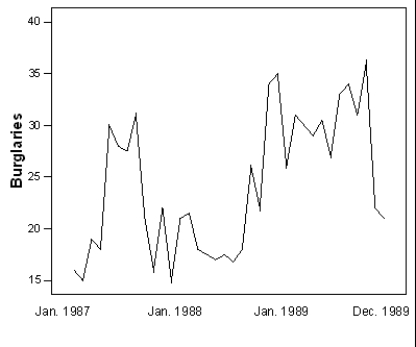 What is approximately the maximum number of burglaries for a month in 1988?
(Multiple Choice)
4.9/5 (45)
The first day of class,the Professor collects information on each student to make a data set that will be analyzed throughout the semester.The information asked includes;hometown,GPA,number of classes taking,number of siblings,and favorite subject.How many quantitative variables are in this data set?
(Multiple Choice)
4.9/5 (24)
The following boxplot is of the birth weights (in ounces)of 160 infants born in a local hospital. 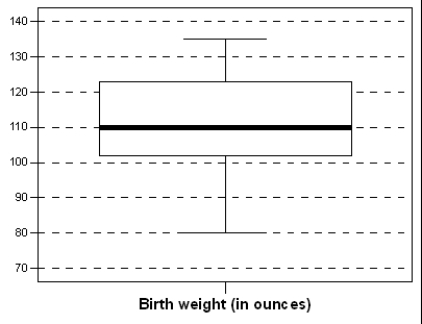 About 40 of the birth weights were below _______________.
(Multiple Choice)
4.9/5 (37)
When displaying the distribution of quantitative data,it is best to use
(Multiple Choice)
4.9/5 (29)
The distribution of a categorical variable is displayed using _______.
(Multiple Choice)
4.9/5 (37)
In a statistics class with 136 students,the professor records how much money each student has in their possession during the first class of the semester.The histogram shown below represents the data he collected. 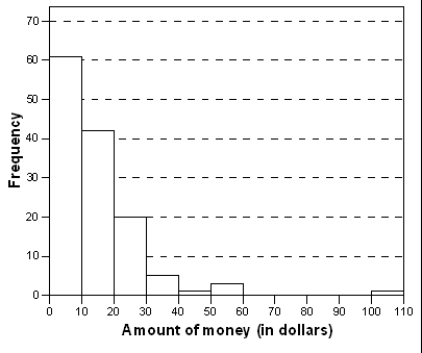 What is approximately the number of students with $30 or more in their possession?
(Multiple Choice)
4.9/5 (38)
The following boxplot is of the birth weights (in ounces)of 160 infants born in a local hospital.  Approximately __________ children had birth weights between 102 and 122 ounces.
(Multiple Choice)
4.8/5 (33)
A researcher reports that,on average,the participants in his study lost 10.4 pounds after 2 months on his new diet.A friend of yours comments that she tried the diet for 2 months and lost no weight,so clearly the report must be a fraud.Which of the following statements is correct?
(Multiple Choice)
4.9/5 (31)
Filters
- Essay(0)
- Multiple Choice(0)
- Short Answer(0)
- True False(0)
- Matching(0)