Exam 7: Sampling Distributions
Exam 1: Describing Data With Graphs134 Questions
Exam 2: Describing Data With Numerical Measures235 Questions
Exam 3: Describing Bivariate Data57 Questions
Exam 4: A: probability and Probability Distributions107 Questions
Exam 4: B: probability and Probability Distributions157 Questions
Exam 5: Several Useful Discrete Distributions166 Questions
Exam 6: The Normal Probability Distribution235 Questions
Exam 7: Sampling Distributions231 Questions
Exam 8: Large-Sample Estimation187 Questions
Exam 9: A: large-Sample Tests of Hypotheses154 Questions
Exam 9: B: large-Sample Tests of Hypotheses106 Questions
Exam 10: A: Inference From Small Samples192 Questions
Exam 10: B: Inference From Small Samples124 Questions
Exam 11: A: The Analysis of Variance136 Questions
Exam 11: B: The Analysis of Variance137 Questions
Exam 12: A: linear Regression and Correlation131 Questions
Exam 12: B: linear Regression and Correlation171 Questions
Exam 13: Multiple Regression Analysis232 Questions
Exam 14: Analysis of Categorical Data158 Questions
Exam 15: A:nonparametric Statistics139 Questions
Exam 15: B:nonparametric Statistics95 Questions
Select questions type
Weights of Candy Bars Narrative
A candy bar company is interested in reducing the percentage of defective candy bars made, where a defective candy bar is one that has too few almonds by weight. The company randomly samples 100 candy bars a day for 5 days and finds the percentage of the defective bars to be 0.0200, 0.0125, 0.0225, 0.0100, and 0.0150, respectively. The company wants to construct a control chart for the proportion defective in samples of size n = 100.
-Refer to Weights of Candy Bars Narrative. Estimate the process fraction defective p.
(Essay)
4.9/5  (36)
(36)
Stress and Sweets Narrative
According to one study, 50% of Canadians admit to overeating sweet foods when stressed. Suppose that the 50% figure is correct and that a random sample of n = 100 Canadians is selected.
-Refer to Stress and Sweets Narrative. What might you conclude if the sample proportion were as small as 34%?
(Essay)
4.8/5 (34)
The Central Limit Theorem indicates that the mean of the sampling distribution of the sample proportion,  , will be equal to the population proportion, p.
(True/False)
4.8/5 (49)
Final Exam Scores Narrative
Suppose a random sample of 25 students is selected from a community college where the scores on the final exam (out of 125 points) are normally distributed having mean equal to 112 and standard deviation equal to 12.
-Refer to Final Exam Scores Narrative. Find the probability that  exceeds 116.
(Essay)
4.8/5 (37)
According to the Central Limit Theorem, if  is the mean of a simple random sample taken from a large population, and if the N population values are not normally distributed, the sampling distribution of
  nevertheless approaches a normal distribution when n
  30 and also n < 0.05N, because these values make the approximation almost perfect.
(True/False)
4.8/5 (37)
Examination Times Narrative
The time necessary to complete an examination has a mean of 45 minutes and a standard deviation of 4 minutes. The average time necessary for 64 randomly selected students is computed.
-Refer to Examination Times Narrative. If the sample mean,  , is actually 50 minutes, what can be said about the claim that = 52?
(Essay)
4.8/5 (37)
A fair die is rolled. If the top face is a 5 or 6, you win $1; otherwise you win nothing. Let  be the amount you win in one play of the game and let
  be the average amount you win in two plays of the game. Find the sampling distribution of
  .
.
(Essay)
4.8/5 (29)
If random samples of size n = 50 are drawn from a non-normal population with finite mean  = 100 and standard deviation
  = 20, then the sampling distribution of the sum of sample measurements
  is approximately normally distributed with mean
  = 5000 and standard deviation
  = 1000.
(True/False)
4.7/5 (26)
The simple random sample is a subset of a population, chosen in such a fashion that every possible subset of like size has an equal chance of being selected.
(True/False)
4.9/5 (39)
Non-random samples can be described and can also be used for making inferences.
(True/False)
4.7/5 (27)
If all possible samples of size n are drawn from a large population with a mean of  and a standard deviation of
  , then the standard error of the sample mean is inversely proportional to which of the values listed below?
A)
B)
C)
D)
, then the standard error of the sample mean is inversely proportional to which of the values listed below?
A)
B)
C)
D)
(Not Answered)
This question doesn't have any answer yet
Unemployment Rate Narrative
An eastern province has an unemployment rate of 6%. The province conducts monthly surveys in order to track the unemployment rate. In a recent month, a random sample of 700 people showed that 35 were unemployed.
-Refer to Unemployment Rate Narrative. If the true unemployment rate is 6%, describe the sampling distribution of  .
.
(Essay)
4.8/5 (43)
In practical business situations, it is very unlikely that a decision maker will actually construct a sampling distribution of any kind.
(True/False)
4.8/5 (34)
The scores of a class are normally distributed with a mean of 82 and a standard deviation of 8. What is the mean of the sampling distribution of the sample mean,  , if a sample of 64 students is selected at random from all students taking that course?
(Multiple Choice)
4.8/5 (36)
Deli Sales Narrative
The total daily sales, x, in the deli section of a large chain of food stores is the sum of the sales generated by a fixed number of customers who make purchases on a given day.
-Refer to Deli Sales Narrative. What kind of probability distribution do you expect the total daily sales to have? Explain.
(Essay)
4.7/5 (25)
According to the Central Limit Theorem, any sampling distribution of the sample proportion  will be normal provided np < 5, while
  .
.
(True/False)
4.9/5 (35)
Examination Times Narrative
The time necessary to complete an examination has a mean of 45 minutes and a standard deviation of 4 minutes. The average time necessary for 64 randomly selected students is computed.
-Refer to Examination Times Narrative. What is the mean of the sampling distribution of  ?
?
(Essay)
4.8/5 (33)
The Central Limit Theorem states that the sample mean,  , is equal to the population mean,
  , provided that
  .
.
(True/False)
4.9/5 (27)
Random samples of size n were selected from three populations with the means and variances given here:
i. 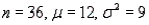 ii.
ii. 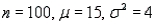 iii.
iii. 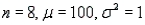 a. Find the mean and standard deviation of the sampling distribution of the sample mean in each of the three cases above.
b. If the sampled populations are normal, are the sampling distributions of
a. Find the mean and standard deviation of the sampling distribution of the sample mean in each of the three cases above.
b. If the sampled populations are normal, are the sampling distributions of  for each of the three cases also normal? Justify your answer.
c. According to the Central Limit Theorem, if the sampled populations are NOT normal, what can be said about the sampling distribution of
for each of the three cases also normal? Justify your answer.
c. According to the Central Limit Theorem, if the sampled populations are NOT normal, what can be said about the sampling distribution of  for each of the three cases?
(Essay)
4.8/5 (34)
Final Exam Scores Narrative
Suppose a random sample of 25 students is selected from a community college where the scores on the final exam (out of 125 points) are normally distributed having mean equal to 112 and standard deviation equal to 12.
-Refer to Final Exam Scores Narrative. Find the probability that the sample mean deviates from the population mean  = 112 by no more than 4.
(Essay)
4.8/5 (29)
Filters
- Essay(0)
- Multiple Choice(0)
- Short Answer(0)
- True False(0)
- Matching(0)