Exam 3: Describing Bivariate Data
Exam 1: Describing Data With Graphs134 Questions
Exam 2: Describing Data With Numerical Measures235 Questions
Exam 3: Describing Bivariate Data57 Questions
Exam 4: A: probability and Probability Distributions107 Questions
Exam 4: B: probability and Probability Distributions157 Questions
Exam 5: Several Useful Discrete Distributions166 Questions
Exam 6: The Normal Probability Distribution235 Questions
Exam 7: Sampling Distributions231 Questions
Exam 8: Large-Sample Estimation187 Questions
Exam 9: A: large-Sample Tests of Hypotheses154 Questions
Exam 9: B: large-Sample Tests of Hypotheses106 Questions
Exam 10: A: Inference From Small Samples192 Questions
Exam 10: B: Inference From Small Samples124 Questions
Exam 11: A: The Analysis of Variance136 Questions
Exam 11: B: The Analysis of Variance137 Questions
Exam 12: A: linear Regression and Correlation131 Questions
Exam 12: B: linear Regression and Correlation171 Questions
Exam 13: Multiple Regression Analysis232 Questions
Exam 14: Analysis of Categorical Data158 Questions
Exam 15: A:nonparametric Statistics139 Questions
Exam 15: B:nonparametric Statistics95 Questions
Select questions type
A scatterplot is particularly useful in determining if the relationship between the independent and dependent variables is not linear.
Free
(True/False)
4.8/5  (41)
(41)
Correct Answer: Verified
True
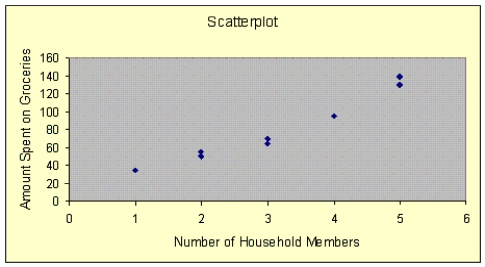
Weekly Amount Spent on Groceries Narrative
The number of household members, x, and the amount spent on groceries per week, y, rounded to the nearest dollar, are measured for eight households in Lakehead area. The data are shown below:  -Refer to Weekly Amount Spent on Groceries Narrative. Draw a scatter plot of these eight data points
Free
(Essay)
4.7/5 (35)
Correct Answer:Verified
Selling Price and Age of Home Narrative
A real estate agent is interested in knowing whether there is a relationship between the age of a house and the selling price. Listed below are the ages (in years) and selling prices (in $1000s) of a sample of six houses the agent has sold in the past year:  -Consider the following set of bivariate data:
  a. Plot the data on a scatterplot.
b. Based on the plot in (a), are there any data points that seem unusual (i.e., are there any outliers)? If so, which one or ones?
c. Ignoring any observations you have considered to be unusual, what can be said about the relationship between the variables x and y?
a. Plot the data on a scatterplot.
b. Based on the plot in (a), are there any data points that seem unusual (i.e., are there any outliers)? If so, which one or ones?
c. Ignoring any observations you have considered to be unusual, what can be said about the relationship between the variables x and y?
Free
(Essay)
4.8/5 (33)
Correct Answer:Verified
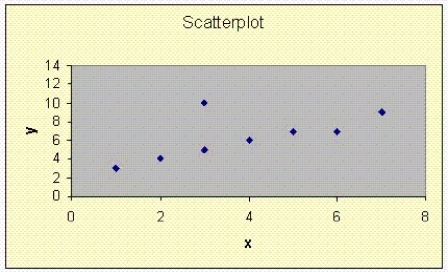 a. There appears to be one outlier: (3, 10)
b. If you ignore the point (3, 10), the variables x and y appear to have a positive linear relationship.
Generally speaking, if two variables are unrelated, what will the covariance be?
(Multiple Choice)
4.7/5 (35)
Soft Drink Sales Narrative
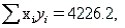
A soft drink distributor was interested in examining the relationship between the number of ads (x) for his product during prime time on a local television station and the number of sales per week (y) in 1000s of cases. She compiled the figures for 20 weeks and computed the following summary information: n = 20, 

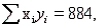
 and
and  .
-Refer to Soft Drink Sales Narrative. Find the best-fitting line relating the number of ads during prime time and weekly sales.
.
-Refer to Soft Drink Sales Narrative. Find the best-fitting line relating the number of ads during prime time and weekly sales.
(Essay)
4.9/5 (43)
Meet Your Match Media Narrative
The Executive Board of a popular online dating website, called Meet Your Match, wanted to know if there was a relationship between the age of a client and the number of persons they made contact with through the site. To find out, a random sample of 50 users from each of the 6 delineated age groups was drawn from its data base of active participants. The users were then surveyed as to how many persons had responded to the introduction email during the previous 3-month period. The average number of initial responses for each of the age groups was then recorded and organized into the following table.  -Refer to Meet Your Match Media Narrative. Of all the graphical techniques available for displaying data, which would be the most useful to determine if any kind of relationship existed between the two variables? Justify your answer.
(Essay)
4.8/5 (36)
Given that  100,
100,  = 64,
= 64,  = 60, and n = 8, what would be the slope of the best-fitting regression line?
(Multiple Choice)
4.8/5 (29)
Legislation Poll
A councillor was interested in determining whether people between the ages of 18 and 30 years of age would react to a piece of legislation differently than people over 30 years of age. The councillor polled a sample of 150 people from his district. The resulting data are shown in the table below:
Reaction  -Refer to the Legislation Poll table. Which of the two types of presentations in the previous two questions is more easily understood?
(Essay)
4.8/5 (30)
Gender Differences Narrative
Male and female respondents to a questionnaire about gender differences are categorized into three groups according to their answers, as shown below:  -Refer to Gender Differences Narrative. Create a side-by-side bar chart to describe these data.
(Essay)
4.8/5 (32)
Gender Differences Narrative
Male and female respondents to a questionnaire about gender differences are categorized into three groups according to their answers, as shown below:
-Refer to Gender Differences Narrative. Create two pie charts (one for men and one for women) to describe these data.
(Essay)
4.8/5 (37)
A perfect correlation between two variables will always produce a correlation coefficient of +1.0.
(True/False)
4.7/5 (43)
Gasoline Prices and Fuel Efficiency Narrative.
When the price of gasoline gets high, consumers become very concerned about the gas mileage obtained by their cars. One consumer was interested in the relationship between car engine size (number of cylinders) and gas mileage (miles/gallon). The consumer took a random sample of 7 cars and recorded the following information:
n = 7, ?xi = 24.7, ?yi = 177, ?xiyi = 600.7, sx = 1.2406,
and
sy=4.3861
-Refer to Gasoline Prices and Fuel Efficiency Narrative. What fuel efficiency would you predict for a car with a 6-cylinder engine?
(Essay)
4.8/5 (32)
The best-fitting line relating the dependent variable y to the independent variable x, often called the regression or least-squares line, is found by minimizing the sum of the squared differences between the data points and the line itself.
(True/False)
4.8/5 (41)
Soft Drink Sales Narrative
A soft drink distributor was interested in examining the relationship between the number of ads (x) for his product during prime time on a local television station and the number of sales per week (y) in 1000s of cases. She compiled the figures for 20 weeks and computed the following summary information: n = 20, and .
-Refer to Soft Drink Sales Narrative. Find the correlation coefficient for the number of ads during prime time and weekly sales.
(Essay)
4.8/5 (44)
Meet Your Match Media Narrative
The Executive Board of a popular online dating website, called Meet Your Match, wanted to know if there was a relationship between the age of a client and the number of persons they made contact with through the site. To find out, a random sample of 50 users from each of the 6 delineated age groups was drawn from its data base of active participants. The users were then surveyed as to how many persons had responded to the introduction email during the previous 3-month period. The average number of initial responses for each of the age groups was then recorded and organized into the following table.
-Refer to Meet Your Match Media Narrative. What are the experimental units?
(Essay)
4.8/5 (38)
Gasoline Prices and Fuel Efficiency Narrative.
When the price of gasoline gets high, consumers become very concerned about the gas mileage obtained by their cars. One consumer was interested in the relationship between car engine size (number of cylinders) and gas mileage (miles/gallon). The consumer took a random sample of 7 cars and recorded the following information:
n = 7, ?xi = 24.7, ?yi = 177, ?xiyi = 600.7, sx = 1.2406,
and
sy=4.3861
-Refer to Gasoline Prices and Fuel Efficiency Narrative. Would you expect the correlation between engine size and fuel efficiency to be positive or negative?
(Essay)
4.9/5 (31)
Which of the following values of the correlation coefficient r indicates a stronger correlation than 0.72?
(Multiple Choice)
4.8/5 (32)
If the correlation coefficient between the independent variable x and the dependent variable y is 0.87, then the best-fitting line would have a slope equal to 0.87.
(True/False)
4.9/5 (27)
Students' GPA Narrative
A law school administrator was interested in whether a student's score on the entrance exam can be used to predict a student's grade point average (GPA) after one year of law school. The administrator took a random sample of 15 students and computed the following summary information, where x = entrance exam score and y = GPA after one year: 


 and
and  .
-Refer to Students' GPA Narrative. Find the best-fitting line relating grade point average after one year of law school and score on the entrance exam.
.
-Refer to Students' GPA Narrative. Find the best-fitting line relating grade point average after one year of law school and score on the entrance exam.
(Essay)
5.0/5 (37)
Given the least squares regression line y = 3.8 - 2x, which of the following best describes the relationship between the two variables?
(Multiple Choice)
4.8/5 (37)
Filters
- Essay(0)
- Multiple Choice(0)
- Short Answer(0)
- True False(0)
- Matching(0)