Exam 13: Multiple Regression Analysis
Exam 1: Describing Data With Graphs134 Questions
Exam 2: Describing Data With Numerical Measures235 Questions
Exam 3: Describing Bivariate Data57 Questions
Exam 4: A: probability and Probability Distributions107 Questions
Exam 4: B: probability and Probability Distributions157 Questions
Exam 5: Several Useful Discrete Distributions166 Questions
Exam 6: The Normal Probability Distribution235 Questions
Exam 7: Sampling Distributions231 Questions
Exam 8: Large-Sample Estimation187 Questions
Exam 9: A: large-Sample Tests of Hypotheses154 Questions
Exam 9: B: large-Sample Tests of Hypotheses106 Questions
Exam 10: A: Inference From Small Samples192 Questions
Exam 10: B: Inference From Small Samples124 Questions
Exam 11: A: The Analysis of Variance136 Questions
Exam 11: B: The Analysis of Variance137 Questions
Exam 12: A: linear Regression and Correlation131 Questions
Exam 12: B: linear Regression and Correlation171 Questions
Exam 13: Multiple Regression Analysis232 Questions
Exam 14: Analysis of Categorical Data158 Questions
Exam 15: A:nonparametric Statistics139 Questions
Exam 15: B:nonparametric Statistics95 Questions
Select questions type
Rocket Experiments Narrative
An engineer was investigating the relationship between the thrust of an experimental rocket (y), the percent composition of a secret chemical in the fuel (x1), and the internal temperature of a chamber of the rocket (x2). The engineer starts by fitting a quadratic model, but he believes that the full quadratic model is too complex and can be reduced by including only the linear terms and the interaction term.
-Refer to Chemical Analysis Narrative. Use the statistical software output below to test whether the reduced model is adequate at the 0.05 level of significance.
Complete Model Regression Analysis
The regression equation is  Analysis of Variance
  Reduced Model Regression Analysis
The regression equation is
Reduced Model Regression Analysis
The regression equation is 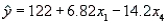 Analysis of Variance
Free
(Essay)
4.8/5  (34)
(34)
Correct Answer: Verified
The hypotheses of interest are 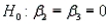 vs.
vs.  At least one of
  or
or  is not 0.
The test statistic is 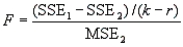 =
= 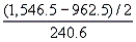 = 1.2136. The critical value of F with
  = 0.05,
  = k - r = 2, and
  = n - (k + 1) = 4 is 6.94. Reject
  if F > 6.94. Since F < 6.94, we fail to reject
  at
at  = 0.05. There is no evidence to indicate that at least one of
  or
or  is not 0. Hence, the reduced model is adequate.
To check out whether the regressions assumption involving normality of the error terms (residuals) is valid, it is appropriate to construct a normal probability plot. If this plot forms a straight line from the lower-left-hand corner to the upper-right-hand corner, the error terms may be assumed to be normally distributed.
Free
(True/False)
4.8/5 (32)
Correct Answer:Verified
True
In a multiple regression model where four independent variables are included in the model, the percentage of explained variation in the dependent variable will be equal to the square root of the sum of the largest correlations between the dependent variable and the four independent variables.
Free
(True/False)
4.8/5 (39)
Correct Answer:Verified
False
Multiple regression analysis is a type of regression analysis in which several independent variables are used to estimate the value of an unknown dependent variable; hence, each of these predictor variables explains part of the total variation of the dependent variable.
(True/False)
4.8/5 (50)
Multicollinearity does not affect the F-test of the analysis of variance.
(True/False)
4.7/5 (36)
When the independent variables are correlated with one another in a multiple regression analysis, what is this condition called?
(Multiple Choice)
4.9/5 (35)
When an additional explanatory variable is introduced into a multiple regression model, the coefficient of multiple determination adjusted for degrees of freedom can never decrease.
(True/False)
4.9/5 (31)
Suppose a regression analysis based on the model 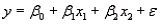 with 15 observations produced SSE = 3.55,
  = 13.131, and
  = 125.1. In this case, what is the proportion of the total variability in y that is accounted for by
  and
and  ?
?
(Multiple Choice)
4.9/5 (30)
In a multiple regression model, it is assumed that the residuals are normally distributed.
(True/False)
4.8/5 (46)
College Textbook Sales Narrative
A publisher of college textbooks conducted a study to relate profit per text y to cost of sales x over a six-year period when its sales force (and sales costs) were growing rapidly. These inflation-adjusted data (in thousands of dollars) were collected:  Expecting profit per book to rise and then plateau, the publisher fitted the model
 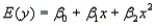 to the data.
-Refer to College Textbook Sales Narrative. Use the values of SSR and Total SS in the printout to calculate
to the data.
-Refer to College Textbook Sales Narrative. Use the values of SSR and Total SS in the printout to calculate  Compare this value with the value given in the printout.
(Essay)
4.7/5 (39)
Demographic Variables and TV Narrative
A statistician wanted to determine if the demographic variables of age, education, and income influence the number of hours of television watched per week. A random sample of 25 adults was selected to estimate the multiple regression model: 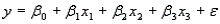 , where y is the number of hours of television watched last week,
  is the age (in years),
  is the number of years of education, and
  is income (in $1000s). The computer output is shown below.
The regression equation is
is income (in $1000s). The computer output is shown below.
The regression equation is 
 S = 4.51 R-Sq = 34.8%
Analysis of Variance
S = 4.51 R-Sq = 34.8%
Analysis of Variance  -Refer to Demographic Variables and TV Narrative. Test the overall validity of the model at the 5% significance level.
(Essay)
4.8/5 (33)
A multiple regression equation includes five independent variables, and the coefficient of determination is 0.81. What is the percentage of the variation in y that is explained by the regression equation?
(Multiple Choice)
4.9/5 (34)
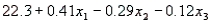
In a multiple regression analysis, the regression equation  is obtained. The
  variable is quantitative variable, and the
  variable is a dummy variable with values 0 and 1. Given this information, we can interpret the slope coefficient (-3) on variable
  as follows: Holding
  constant, if the value of
  is changed from 0 to 1, the average value of y will decrease by 3 units.
(True/False)
4.8/5 (33)
Multicollinearity is present when there is a high degree of correlation between the dependent variable and all the independent variables included in the model.
(True/False)
4.9/5 (43)
In multiple regression, the prediction equation  is the line that minimizes SSE, the sum of squares of the deviations of the observed values y from the predicted values
  .
.
(True/False)
4.7/5 (40)
Plots of the residuals against  or against the individual independent variables
  often indicate departures from the assumptions required for an analysis of variance, and they also may suggest changes in the underlying model.
(True/False)
4.9/5 (30)
A multiple regression model has the form  . As
. As  increases by one unit, holding
  constant, the value of y will increase by 9 units.
(True/False)
4.7/5 (41)
A three-variable multiple regression establishes an estimated multiple regression equation. Which of the following is a property of that equation?
(Multiple Choice)
4.9/5 (32)
In testing the validity of a multiple regression model, a large value of the F-test statistic is indicative of which of the following situations?
(Multiple Choice)
4.8/5 (33)
Filters
- Essay(0)
- Multiple Choice(0)
- Short Answer(0)
- True False(0)
- Matching(0)