Exam 10: A: Inference From Small Samples
Exam 1: Describing Data With Graphs134 Questions
Exam 2: Describing Data With Numerical Measures235 Questions
Exam 3: Describing Bivariate Data57 Questions
Exam 4: A: probability and Probability Distributions107 Questions
Exam 4: B: probability and Probability Distributions157 Questions
Exam 5: Several Useful Discrete Distributions166 Questions
Exam 6: The Normal Probability Distribution235 Questions
Exam 7: Sampling Distributions231 Questions
Exam 8: Large-Sample Estimation187 Questions
Exam 9: A: large-Sample Tests of Hypotheses154 Questions
Exam 9: B: large-Sample Tests of Hypotheses106 Questions
Exam 10: A: Inference From Small Samples192 Questions
Exam 10: B: Inference From Small Samples124 Questions
Exam 11: A: The Analysis of Variance136 Questions
Exam 11: B: The Analysis of Variance137 Questions
Exam 12: A: linear Regression and Correlation131 Questions
Exam 12: B: linear Regression and Correlation171 Questions
Exam 13: Multiple Regression Analysis232 Questions
Exam 14: Analysis of Categorical Data158 Questions
Exam 15: A:nonparametric Statistics139 Questions
Exam 15: B:nonparametric Statistics95 Questions
Select questions type
The necessary conditions having been met, a two-tail test is being conducted at  = 0.05 to test
 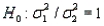 . The two sample variances are
 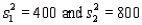 , and the sample sizes are
 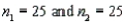 . The calculated value of the test statistic will be F = 2.
Free
(True/False)
4.8/5  (39)
(39)
Correct Answer: Verified
False
On which of the following does the shape of the Student's t distribution primarily depend?
Free
(Multiple Choice)
4.9/5 (31)
Correct Answer:Verified
B
For an F distribution test statistic, the number of degrees of freedom associated with its denominator must be larger than the number of degrees of freedom associated with its numerator.
Free
(True/False)
5.0/5 (42)
Correct Answer:Verified
False
A random sample of size 10 produced a sample mean equal to 12 and a standard deviation equal to 0.15. Based on this information, the upper limit for a 95% confidence interval estimate is approximately 12.107.
(True/False)
4.9/5 (35)
For a given level of significance, increasing the sample size will tend to increase the chi-square critical value used in testing the null hypothesis about a population variance.
(True/False)
4.7/5 (28)
In constructing a 90% interval estimate for the ratio of two population variances,  /
/  , two independent samples of sizes 40 and 60 are drawn from the populations. The sample variances are 515 and 920. What is the lower confidence limit?
(Multiple Choice)
4.8/5 (30)
The t distribution approaches the standard normal distribution as the number of degrees of freedom increases.
(True/False)
4.9/5 (39)
The area to the right of a chi-square variable is 0.025. For five degrees of freedom, the critical value is 11.143.
(True/False)
4.8/5 (35)
When we test for differences between the means of two independent populations, we can use only a two-tailed test.
(True/False)
4.8/5 (36)
In testing the equality of two population variances, when the populations are normally distributed, the 5% level of significance has been used. To determine the rejection region, you will refer to the F table corresponding to an upper-tail area of 0.025.
(True/False)
4.8/5 (34)
A statistics professor wanted to test whether the grades on statistics test were the same for first- and third-year students. The professor took a random sample of size 12 from each and conducted a test, determining that the variances were equal. For this situation, the professor should use a matched pairs t test.
(True/False)
4.8/5 (38)
Which of the following is the best description of a robust estimator?
(Multiple Choice)
4.8/5 (30)
Which of the following values is the number of degrees of freedom associated with the t test when the data are gathered from a matched pairs experiment with 21 pairs?
(Multiple Choice)
4.9/5 (34)
In testing the difference between two population means using two independent random samples, the population standard deviations are assumed to be known, and the calculated test statistic equals 2.75. If the test is two-tailed and 5% level of significance has been specified, the conclusion should be not to reject the null hypothesis.
(True/False)
4.8/5 (37)
On which of the following does the shape of the chi-square distribution depend?
(Multiple Choice)
4.8/5 (30)
For an F distribution test statistic, the number of degrees of freedom associated with its denominator must be smaller than the number of degrees of freedom associated with its numerator.
(True/False)
4.9/5 (34)
If a sample has 10 observations and a 90% confidence estimate for  is needed, the appropriate t score is 1.833.
(True/False)
4.8/5 (35)
In testing the difference between two population means using two independent random samples, we use the pooled variance in estimating the standard error of the sampling distribution of the sample mean difference  if the populations are normal with equal variances.
(True/False)
4.8/5 (40)
For an F distribution test statistic, the number of degrees of freedom associated with its denominator can be larger, smaller, or equal to the number of degrees of freedom associated with its numerator.
(True/False)
4.8/5 (33)
Two independent samples of sizes 40 and 50 are randomly selected from two populations to test the difference between the population means  . Which of the following best describes the sampling distribution of the sample mean difference
  ?
?
(Multiple Choice)
4.7/5 (35)
Filters
- Essay(0)
- Multiple Choice(0)
- Short Answer(0)
- True False(0)
- Matching(0)