Exam 1: Describing Data With Graphs
Exam 1: Describing Data With Graphs134 Questions
Exam 2: Describing Data With Numerical Measures235 Questions
Exam 3: Describing Bivariate Data57 Questions
Exam 4: A: probability and Probability Distributions107 Questions
Exam 4: B: probability and Probability Distributions157 Questions
Exam 5: Several Useful Discrete Distributions166 Questions
Exam 6: The Normal Probability Distribution235 Questions
Exam 7: Sampling Distributions231 Questions
Exam 8: Large-Sample Estimation187 Questions
Exam 9: A: large-Sample Tests of Hypotheses154 Questions
Exam 9: B: large-Sample Tests of Hypotheses106 Questions
Exam 10: A: Inference From Small Samples192 Questions
Exam 10: B: Inference From Small Samples124 Questions
Exam 11: A: The Analysis of Variance136 Questions
Exam 11: B: The Analysis of Variance137 Questions
Exam 12: A: linear Regression and Correlation131 Questions
Exam 12: B: linear Regression and Correlation171 Questions
Exam 13: Multiple Regression Analysis232 Questions
Exam 14: Analysis of Categorical Data158 Questions
Exam 15: A:nonparametric Statistics139 Questions
Exam 15: B:nonparametric Statistics95 Questions
Select questions type
The librarian of a small community library has compiled the number of people who visited the library and the respective number of checked-out books, and has created the line chart shown below. Interpret the chart, where the solid line is the number of visitors and the dashed line is the number of books checked out. 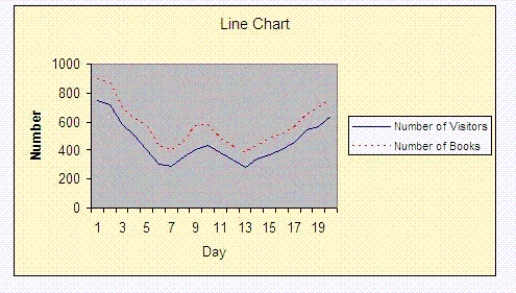
(Essay)
4.9/5  (40)
(40)
Kittens in Litters
The following data represent the numbers of kittens born in litters for a particular breed of cat: 4, 5, 3, 6, 5, 5, 3, 4, 4, 5, 7, 5, 6, 6, 7, 4, 5, 5, 6, and 6.
-Refer to the Kittens in Litters statement. What proportion of litters has more than five kittens?
(Essay)
4.9/5 (36)
Absenteeism
A high school band teacher has a record of each student's absence. The results, in days, are 3, 4, 7, 2, 2, 1, 0, 0, 1, 0, 3, 3, 2, 1, 6, 0, 1, 0, 1, 1, 1, 5, 3, 1, 1, 0, 0, 2, 1, 2, 1, 0, 0, and 4.
-Refer to the Absenteeism statement. How many students have been absent more than five days?
(Short Answer)
4.9/5 (30)
When constructing a frequency distribution for categorical data, it is always necessary to develop class boundaries.
(True/False)
4.9/5 (37)
The freshness and overall quality of milk depend upon the type of packaging used. The manager of a dairy company is considering changing the packaging from cartons to plastic. The quality control team of this dairy company packaged milk in 100 containers of each type of material. After a specific amount of time, the team tested the milk for freshness and overall quality. Identify the population and the sample in this .
(Essay)
4.7/5 (38)
Weight of Bag of Potatoes
The weight of a bag of potatoes is supposed to be 5 kilograms. Each bag may vary slightly from this standard. The weights for 18 bags of potatoes are as follow: 4.5, 5.0, 5.1, 6.0, 5.2, 3.9, 4.7, 4.9, 5.5, 5.6, 5.1, 4.9, 6.1, 4.8, 4.9, 5.1, 4.6, and 3.5.
-Refer to the Weight of Bag of Potatoes statement. What can be said about the shape of the distribution of the data? Why?
(Essay)
4.8/5 (41)
Social Media
The Executive Board of a popular social media website wanted to know which kinds of professional people were accessing their website regularly over a two-month period. To that end, a random sample from its database of active users was collected. The following data were recorded:  -Refer to the Social Media table. What is the sample size of the data collected?
(Short Answer)
4.7/5 (32)
A hospital administration would like to know the average length of a hospital stay. It would be almost impossible to look through all the past records and average the lengths of stay. Instead, a sample of 1000 patients over the past year was randomly chosen and their lengths of stay were averaged. Describe the population and the sample in this .
(Essay)
4.8/5 (34)
A relative frequency histogram can be constructed for qualitative as well as quantitative data.
(True/False)
4.9/5 (24)
A stem-and-leaf plot is used to display the distribution of which of the following kinds of data?
(Multiple Choice)
4.7/5 (27)
Statistical inference is the process of making an estimate, prediction, or decision about a population based on sample data.
(True/False)
4.9/5 (34)
If the six bars of a relative frequency histogram each have a width of five units, then the total area is 5.
(True/False)
4.9/5 (36)
Persons or objects that have characteristics of interest to statisticians are called variables.
(True/False)
4.8/5 (44)
Lecture Notes
The numbers of pages of notes per lecture taken by a student in a beginning statistics course are as follow: 1, 5, 2, 6, 2, 3, 3, 4, 4, 4, 5, 5, 5, 5, 5, 5, 6, 6, 6, 6, 6, 6, 6, 6, 5, 6, 4, 5, and 6.
-Refer to the Lecture Notes statement. Construct a dotplot to describe the data.
(Essay)
4.8/5 (42)
A highway department would like to repair a certain highway during the slowest part of a day to help minimize traffic congestion. Because it would be impossible to monitor the traffic flow on every day, the department monitors how many vehicles pass on this highway during one particular day. Based on these results, the department decides when to repair the highway. Describe the population and the sample in this .
(Essay)
4.9/5 (39)
Social Media
The Executive Board of a popular social media website wanted to know which kinds of professional people were accessing their website regularly over a two-month period. To that end, a random sample from its database of active users was collected. The following data were recorded:
-Refer to the Social Media table. What are the experimental units?
(Essay)
4.8/5 (37)
Suppose you are given a graphical portrayal of a relative frequency distribution of continuous quantitative data with the following characteristics. The lower and upper limits of the data classes are identified by tick marks on a horizontal axis. The corresponding relative class frequencies are represented by the areas of vertical rectangles connected to each other and positioned on top of each of these class intervals. What is such a graphical presentation called?
(Multiple Choice)
4.9/5 (29)
It is often a good idea to convert frequency distributions to relative frequency distributions when you compare two distributions with different amounts of data.
(True/False)
4.7/5 (44)
A relative frequency distribution describes the proportion of the data values falling within each category.
(True/False)
4.9/5 (37)
Filters
- Essay(0)
- Multiple Choice(0)
- Short Answer(0)
- True False(0)
- Matching(0)