Exam 19: International Trade
Exam 1: Introduction to Macroeconomics35 Questions
Exam 2: Measuring the Macroeconomy114 Questions
Exam 3: An Overview of Long-Run Economic Growth110 Questions
Exam 4: A Model of Production129 Questions
Exam 5: The Solow Growth Model126 Questions
Exam 6: Growth and Ideas120 Questions
Exam 7: The Labor Market, Wages, and Unemployment119 Questions
Exam 8: Inflation117 Questions
Exam 9: An Introduction to the Short Run113 Questions
Exam 10: The Great Recession: a First Look108 Questions
Exam 11: The Is Curve128 Questions
Exam 12: Monetary Policy and the Phillips Curve135 Questions
Exam 13: Stabilization Policy and the Asad Framework113 Questions
Exam 14: The Great Recession and the Short-Run Model112 Questions
Exam 15: Dsge Models: the Frontier of Business Cycle Research119 Questions
Exam 16: Consumption109 Questions
Exam 17: Investment116 Questions
Exam 18: The Government and the Macroeconomy122 Questions
Exam 19: International Trade107 Questions
Exam 20: Exchange Rates and International Finance142 Questions
Exam 21: Parting Thoughts35 Questions
Select questions type
Figure 19.1: U.S. Real Income Growth and Net Exports to China 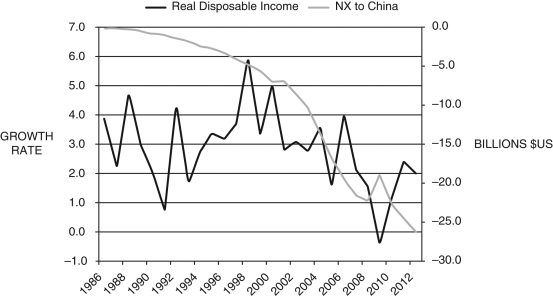 -Consider Figure 19.1, which shows growth of U.S. real disposable income (left scale) and net exports to China (right). Explain how this graph supports, or does not, studies done by economists in the 1980s and 1990s on the impacts of trade on U.S. employment.
Free
(Essay)
4.8/5  (30)
(30)
Correct Answer: Verified
Economists of the period found little impact of trade on employment. This is likely because most trade in that period was with other high-income countries. Because productivity, and therefore wages, was more or less the same, there were no real gains to "outsourcing."
However, in the 1990s and 2000s, as larger emerging markets (e.g., China) began to enter trade markets, they began to take some of the higher wage manufacturing jobs away from the United States. The graph above shows a slowing of real income growth beginning in about 1998; this coincides with the growth of the trade deficit with China. Thus, based on this (very oversimplified) graph, one could conclude that research that suggests the same is true.
When the central government runs a budget deficit, the economy runs the risk of ________; this phenomenon is called ________.
Free
(Multiple Choice)
4.8/5 (41)
Correct Answer:Verified
B
The basic motivation for international trade is that:
Free
(Multiple Choice)
4.9/5 (37)
Correct Answer:Verified
A
U.S. imports' share of GDP is about ________ percent, while exports' share was about ________ percent in recent years.
(Multiple Choice)
4.9/5 (39)
Refer to the following table when answering the following questions.
Table 19.1: East and West Fish and Chip Production 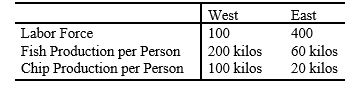 -Consider Table 19.1. In the East, with autarky, per person consumption of fish is ________ kilos and per person chip consumption is ________ kilos, assuming people spend half their incomes on each good.
(Multiple Choice)
4.8/5 (33)
The net flow of goods is associated with a net flow of financial assets in the opposite direction.
(True/False)
4.9/5 (44)
Refer to the following table when answering the following questions.
Table 19.1: East and West Fish and Chip Production
-Consider Table 19.1. In autarky, the price of fish in terms of chips is ________ in the West, and in the East the price is ________.
(Multiple Choice)
5.0/5 (37)
Economists call an economy in which each person produces all the goods he or she consumes a Robinson Crusoe economy.
(True/False)
4.7/5 (47)
According to a study conducted by Jagdish Bhagwati, Arvind Panagariya, and T. N. Srinivasan, the overall impacts of ________ in the U.S. economy are small because ________.
(Multiple Choice)
4.8/5 (33)
Economists have done a good job of explaining the benefits of free trade.
(True/False)
4.9/5 (28)
Refer to the following table when answering the following questions.
Table 19.1: East and West Fish and Chip Production
-Consider Table 19.1. With free trade in the East, fish consumption ________ and potato consumption ________, compared to autarky.
(Multiple Choice)
4.9/5 (24)
Refer to the following table when answering the following questions.
Table 19.1: East and West Fish and Chip Production
-Consider Table 19.1. With free trade in the West, fish consumption ________ and potato consumption ________, compared to autarky.
(Multiple Choice)
5.0/5 (33)
When the central government runs a budget deficit and the economy has a trade deficit, we call it the J-curve.
(True/False)
4.8/5 (24)
According to the President's Council of Economic Advisers, "The gains from trade that take place ________ are no different than the gains from trade ________. When a good or service is produced at lower cost in another country, it makes sense to import it rather than to produce it domestically."
(Multiple Choice)
4.8/5 (30)
In recent years, about ________ percent of the U.S. GDP was exported.
(Multiple Choice)
4.8/5 (29)
The national income identity can be rearranged to yield the relationship between:
(Multiple Choice)
4.8/5 (26)
Generally, the losses due to free trade are ________, and the benefits are ________.
(Multiple Choice)
4.8/5 (40)
If a country is better at producing all goods, it has a(n):
(Multiple Choice)
5.0/5 (36)
Filters
- Essay(0)
- Multiple Choice(0)
- Short Answer(0)
- True False(0)
- Matching(0)