Exam 18: The Government and the Macroeconomy
Exam 1: Introduction to Macroeconomics35 Questions
Exam 2: Measuring the Macroeconomy114 Questions
Exam 3: An Overview of Long-Run Economic Growth110 Questions
Exam 4: A Model of Production129 Questions
Exam 5: The Solow Growth Model126 Questions
Exam 6: Growth and Ideas120 Questions
Exam 7: The Labor Market, Wages, and Unemployment119 Questions
Exam 8: Inflation117 Questions
Exam 9: An Introduction to the Short Run113 Questions
Exam 10: The Great Recession: a First Look108 Questions
Exam 11: The Is Curve128 Questions
Exam 12: Monetary Policy and the Phillips Curve135 Questions
Exam 13: Stabilization Policy and the Asad Framework113 Questions
Exam 14: The Great Recession and the Short-Run Model112 Questions
Exam 15: Dsge Models: the Frontier of Business Cycle Research119 Questions
Exam 16: Consumption109 Questions
Exam 17: Investment116 Questions
Exam 18: The Government and the Macroeconomy122 Questions
Exam 19: International Trade107 Questions
Exam 20: Exchange Rates and International Finance142 Questions
Exam 21: Parting Thoughts35 Questions
Select questions type
In 2012, the ratio of government spending to GDP in Denmark, France, and Sweden was ________ percent.
Free
(Multiple Choice)
4.8/5  (34)
(34)
Correct Answer: Verified
B
________ is/are what may happen when the central government needs to borrow to finance its deficit to the detriment of private firms.
Free
(Multiple Choice)
4.8/5 (35)
Correct Answer:Verified
B
In 2015, the largest single source of U.S. federal government revenue was:
Free
(Multiple Choice)
4.9/5 (36)
Correct Answer:Verified
A
The CBO forecasts that the number of workers per retiree in the Social Security program will rise from 2 to 3.3 in the coming decades.
(True/False)
4.8/5 (31)
Generational accounting implies that, holding the present value of government spending constant, budget deficits will not crowd out investment.
(True/False)
4.8/5 (35)
There is a "magic level" of the debt-GDP ratio that triggers government default.
(True/False)
4.7/5 (35)
In 2012, the ratio of all levels of government spending to GDP in the United States was about ________ percent.
(Multiple Choice)
4.8/5 (45)
Refer to the following figure when answering the following questions.
Figure 18.2: Government Outlays and Receipts as a Percentage
of GDP, 1947-2012 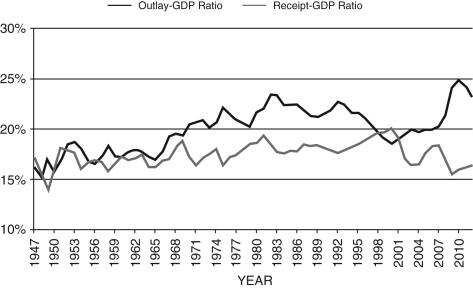 -Consider Figure 18.2. What was the cause of the huge budget deficit beginning in 1981?
(Multiple Choice)
4.8/5 (31)
Figure 18.5 below shows German and Italian GDP (solid) and government debt (dashed) for the period 1996-2014. Which country is likely to have more sustainable debt? Explain. Which country is more likely to default on its debt and have higher government bond interest rates?Figure 18.5: German and Italian GDP and Government Debt: 1996-2014 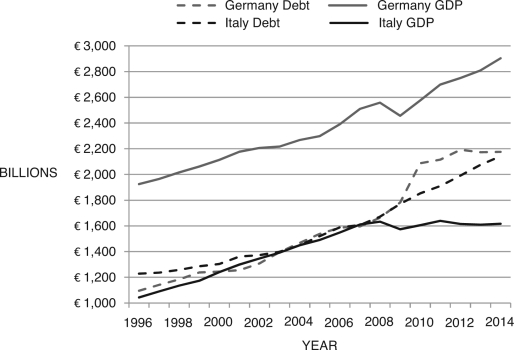
(Essay)
4.8/5 (32)
In the euro area, the average government spending-to-GDP ratio in 2014 was about ________ percent.
(Multiple Choice)
4.9/5 (38)
The national income identity can be rearranged to show that private saving + government saving+ foreign saving = investment.
(True/False)
4.8/5 (34)
If domestic saving is less than domestic investment, then investment can be financed by:
(Multiple Choice)
4.8/5 (32)
The national income identity can be rearranged to show that ________ equals ________.
(Multiple Choice)
4.8/5 (29)
The debt-to-GDP ratio in the United States was over 100 percent during World War II.
(True/False)
4.9/5 (36)
In 2015, the largest single U.S. federal government expenditure was:
(Multiple Choice)
4.9/5 (34)
An explanation of why governments are willing to burden future generations with debt to finance a war today is that:
(Multiple Choice)
4.8/5 (33)
In 2014, the debt-to-GDP ratio in the United States was about ________ percent.
(Multiple Choice)
4.9/5 (35)
The government's intertemporal budget constraint assumes the budget is always balanced.
(True/False)
4.9/5 (29)
According to the Congressional Budget Office report "A 125-Year Picture of the Federal Government's Share of the Economy, 1950 to 2075," Medicare, Medicaid, and Social Security will be about ________ percent of GDP in 2030.
(Multiple Choice)
4.9/5 (31)
Refer to the following figure when answering the following questions.
Figure 18.2: Government Outlays and Receipts as a Percentage
of GDP, 1947-2012
-Consider Figure 18.2. During which of the following periods did the federal government run a budget surplus?
(Multiple Choice)
4.8/5 (33)
Filters
- Essay(0)
- Multiple Choice(0)
- Short Answer(0)
- True False(0)
- Matching(0)