Exam 16: Consumption
Exam 1: Introduction to Macroeconomics35 Questions
Exam 2: Measuring the Macroeconomy114 Questions
Exam 3: An Overview of Long-Run Economic Growth110 Questions
Exam 4: A Model of Production129 Questions
Exam 5: The Solow Growth Model126 Questions
Exam 6: Growth and Ideas120 Questions
Exam 7: The Labor Market, Wages, and Unemployment119 Questions
Exam 8: Inflation117 Questions
Exam 9: An Introduction to the Short Run113 Questions
Exam 10: The Great Recession: a First Look108 Questions
Exam 11: The Is Curve128 Questions
Exam 12: Monetary Policy and the Phillips Curve135 Questions
Exam 13: Stabilization Policy and the Asad Framework113 Questions
Exam 14: The Great Recession and the Short-Run Model112 Questions
Exam 15: Dsge Models: the Frontier of Business Cycle Research119 Questions
Exam 16: Consumption109 Questions
Exam 17: Investment116 Questions
Exam 18: The Government and the Macroeconomy122 Questions
Exam 19: International Trade107 Questions
Exam 20: Exchange Rates and International Finance142 Questions
Exam 21: Parting Thoughts35 Questions
Select questions type
To analyze Ricardian equivalence using the neoclassical consumption model, we must:
Free
(Multiple Choice)
4.8/5  (36)
(36)
Correct Answer: Verified
A
An implication of Figure 16.2 is that consumers:
Free
(Multiple Choice)
4.8/5 (43)
Correct Answer:Verified
A
In 1992, the first Bush administration was worried about a lingering recession. The administration announced that households would receive a reduction in their taxes for the year 1992. However, this was not accompanied by a reduction in tax rates, and the taxes would have to be repaid when households filed their taxes in April 1993. Explain the impact of such a policy.
(Essay)
4.7/5 (36)
Refer to the following figure when answering the following questions.
Figure 16.4: Personal Saving Rate: 1990-2010 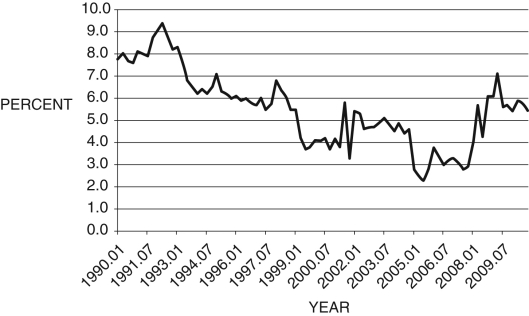 -Consider Figure 16.4. A possible cause for the fall in the saving rate between 1990 and 2005 is:
(Multiple Choice)
4.8/5 (36)
Figure 16.8: Personal Savings Rates 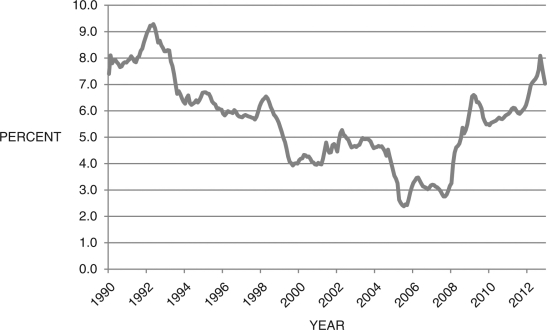 (Source: Federal Reserve Economic Data, St. Louis Federal Reserve)
-Your high school economics teacher recently saw the graph of personal savings rates above. She knows you are taking economics in college and is curious to hear your opinion about what is causing the general trends in savings rates from 1990-2012. What do you tell her?
(Source: Federal Reserve Economic Data, St. Louis Federal Reserve)
-Your high school economics teacher recently saw the graph of personal savings rates above. She knows you are taking economics in college and is curious to hear your opinion about what is causing the general trends in savings rates from 1990-2012. What do you tell her?
(Essay)
4.7/5 (27)
Consider Figure 16.7 below, which shows the federal funds rate and household consumption. For your answers, use a logarithmic utility function.
(a) What is the relationship between consumption growth and the interest rate according to
the Euler equation?
(b) Does the data in the figure support or reject this relationship for the entire period? Explain.
(c) What might help explain consumption behavior, particularly in 2008-2009?Figure 16.7: Federal Funds Rate and Household Consumption: 2002-2016 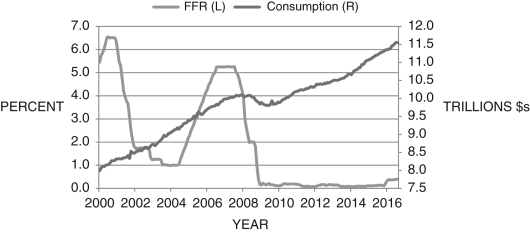 (Source: Federal Reserve Economic Data, St. Louis Federal Reserve)
(Essay)
4.8/5 (36)
Consider consumption in two periods,  and
and  . Consumption smoothing implies people prefer to consume
  if
if  and R = 0.
(True/False)
4.8/5 (39)
If =1 and R=0, and if you prefer  in each period 1 and 2 rather than u(c1) + u(c2), then you are:
(Multiple Choice)
4.7/5 (31)
As a college student, you are likely to be impatient; therefore, your consumption growth rate
Would be:
(Multiple Choice)
4.8/5 (30)
The left-hand side of the Euler equation, 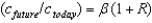 , represents total lifetime consumption, in dollars.
(True/False)
4.7/5 (33)
Refer to the following figure when answering the following questions.
Figure 16.1: Consumption Function 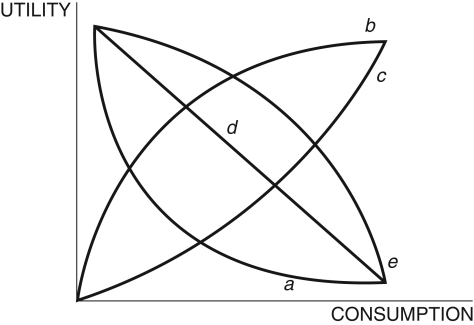 -Consider the utility functions in Figure 16.1. Curve b exhibits:
(Multiple Choice)
4.8/5 (33)
Filters
- Essay(0)
- Multiple Choice(0)
- Short Answer(0)
- True False(0)
- Matching(0)