Exam 9: Production and Cost in the Long Run
Exam 1: Managers, profits, and Markets30 Questions
Exam 2: Demand, supply, and Market Equilibrium64 Questions
Exam 3: Marginal Analysis for Optimal Decision Making96 Questions
Exam 4: Basic Estimation Techniques19 Questions
Exam 5: Theory of Consumer Behavior69 Questions
Exam 6: Elasticity and Demand77 Questions
Exam 7: Demand Estimation and Forecasting65 Questions
Exam 8: Production and Cost in the Short Run100 Questions
Exam 9: Production and Cost in the Long Run89 Questions
Exam 10: Production and Cost Estimation55 Questions
Exam 11: Managerial Decisions in Competitive Markets90 Questions
Exam 12: Managerial Decisions for Firms With Market Power110 Questions
Exam 13: Strategic Decision Making in Oligopoly Markets42 Questions
Exam 14: Advanced Pricing Techniques57 Questions
Exam 15: Decisions Under Risk and Uncertainty60 Questions
Exam 16: Government Regulation of Business50 Questions
Select questions type
Refer to the following graph.The price of capital r)is $20. 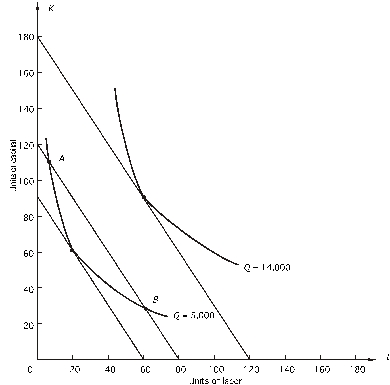 Why wouldn't the firm choose to produce 5,000 units of output with the combination at A?
(Multiple Choice)
4.7/5  (29)
(29)
Refer to the following graph.The price of capital r)is $20. 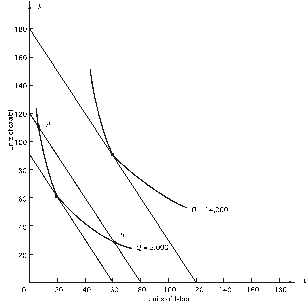 What combination of K and L should the firm choose to produce 14,000 units of output at the lowest cost?
(Multiple Choice)
4.7/5 (30)
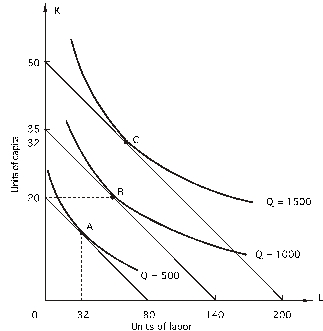
Refer to the following figure.The price of capital is $50 per unit:  How many units of labor should the firm use in order to produce 400 units of output at the least cost?
(Multiple Choice)
4.9/5 (42)
Refer to the following figure.The price of capital is $50 per unit:  How many units of labor should the firm use to produce 1,200 units of output at least cost?
(Multiple Choice)
4.9/5 (37)
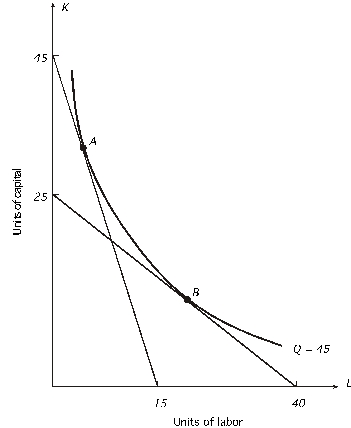
Refer to the following graph.The price of labor is $3 per unit: 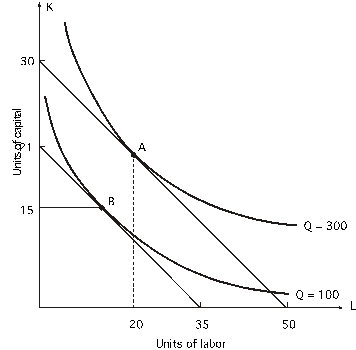 What is the marginal rate of technical substitution at point B?
(Multiple Choice)
4.8/5 (35)
In the graph below,the price of capital is $500 per unit.Given a total cost of $50,000,the maximum amount of output possible is 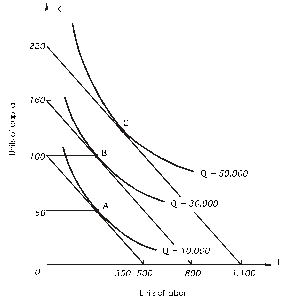
(Multiple Choice)
4.9/5 (36)
Refer to the following graph.The price of capital r)is $20. 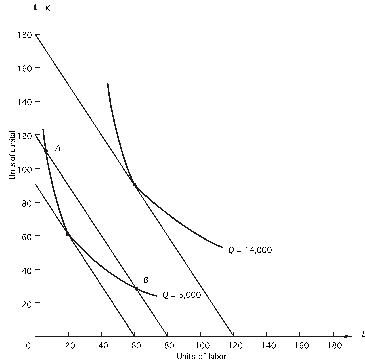 What is the price of labor w)?
(Multiple Choice)
4.8/5 (42)
Following is a firm's expansion path.The price of capital is $5 per unit; the price of labor is $2 per unit.  When output is 20 units,what is long-run average cost?
(Multiple Choice)
4.8/5 (41)
Following is a firm's expansion path.The price of capital is $5 per unit; the price of labor is $2 per unit.  When output is 30 units,what is long-run total cost?
(Multiple Choice)
4.9/5 (35)
Suppose that when a firm increases output by 50%,long-run total cost increases by less than 50%.The firm will experience
(Multiple Choice)
4.8/5 (30)
 Given the above graph,if the firm continues to produce 45 units of output and moves from point A to point B,it must be true that
(Multiple Choice)
4.8/5 (43)
In the following graph,the price of capital is $100 per unit; the price of labor is $25 per unit.When output is 20 units,what is AVERAGE cost? 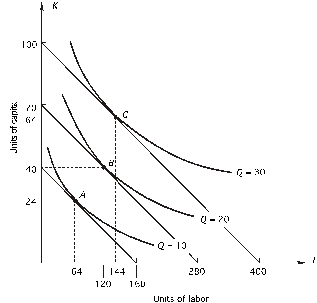
(Multiple Choice)
4.9/5 (34)
 -In the following graph,the price of capital is $100 per unit.Which of the following combinations of capital and labor lies on the expansion path?
(Multiple Choice)
4.8/5 (40)
Refer to the following figure.The price of capital is $50 per unit: 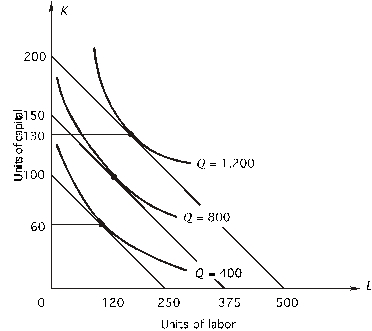 The minimum cost of producing 800 units of output is
(Multiple Choice)
4.8/5 (37)
In the graph below,the price of capital is $500 per unit.At point A,the firm can exchange 
(Multiple Choice)
4.9/5 (39)
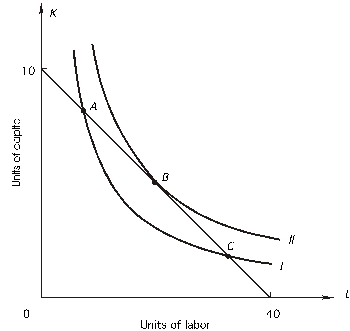 Given the above graph,as you move from input combination A to input combination C,
(Multiple Choice)
4.8/5 (31)
Filters
- Essay(0)
- Multiple Choice(0)
- Short Answer(0)
- True False(0)
- Matching(0)