Multiple Choice
Which of the following graphs best represents the relationship between the concentration of reactants and products with respect to time for the following chemical reaction?
2 H2(g) + O2(g)  2 H2O(g)
A) 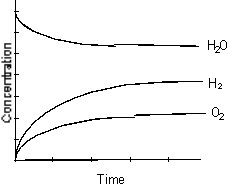
B) 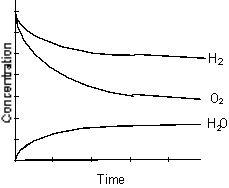
C) 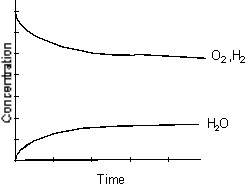
D) 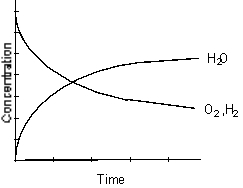
E) 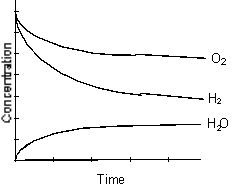
Correct Answer:

Verified
Correct Answer:
Verified
Q14: Hidden Assumptions that make Equilibrium Calculations Easier
Q15: Calculate the COCl<sub>2</sub>, CO, and Cl<sub>2</sub> concentrations
Q16: Which of the following factors will
Q17: For the following reaction:<br>2 NOCl(g) <img src="https://d2lvgg3v3hfg70.cloudfront.net/TB9692/.jpg"
Q18: Based on the information given in the
Q20: Assume that the equilibrium constant for the
Q21: A 50.0 mL solution of 0.015 M
Q22: Which is the correct reaction for the
Q23: Which of the following statements is correct?<br>A)
Q24: What is the effect of increasing the