Exam 2: The Basics of Supply and Demand
Exam 1: Preliminaries78 Questions
Exam 2: The Basics of Supply and Demand139 Questions
Exam 3: Consumer Behavior134 Questions
Exam 4: Individual and Market Demand131 Questions
Exam 5: Uncertainty and Consumer Behavior150 Questions
Exam 6: Production125 Questions
Exam 7: The Cost of Production178 Questions
Exam 8: Profit Maximization and Competitive Supply164 Questions
Exam 9: The Analysis of Competitive Markets183 Questions
Exam 10: Market Power: Monopoly and Monopsony158 Questions
Exam 11: Pricing With Market Power130 Questions
Exam 12: Monopolistic Competition and Oligopoly120 Questions
Exam 13: Game Theory and Competitive Strategy150 Questions
Exam 14: Markets for Factor Inputs134 Questions
Exam 15: Investment, Time, and Capital Markets153 Questions
Exam 16: General Equilibrium and Economic Efficiency126 Questions
Exam 17: Markets With Asymmetric Information133 Questions
Exam 18: Externalities and Public Goods131 Questions
Exam 19: Behavioral Economics101 Questions
Select questions type
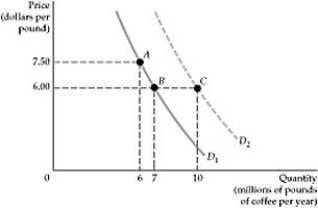 Figure 2.1.2
-Refer to Figure 2.1.2. The price of coffee is currently $6.00. and quantity demanded is 7 million pounds. Then there is a notable increase in the preference for coffee over other substitutes, like tea. Which move best describes this change?
Figure 2.1.2
-Refer to Figure 2.1.2. The price of coffee is currently $6.00. and quantity demanded is 7 million pounds. Then there is a notable increase in the preference for coffee over other substitutes, like tea. Which move best describes this change?
(Multiple Choice)
4.8/5  (38)
(38)
Which of the following represents the income elasticity of demand?
(Multiple Choice)
4.9/5 (37)
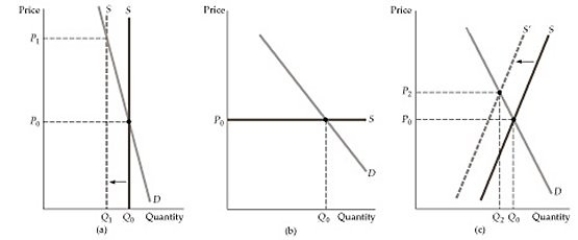 Figure 2.5.6
-In order to fit linear supply and demand curves to data, we need to find the parameters, a, b, c, and d, of the corresponding functions. One procedure for finding those values uses the known values of:
Figure 2.5.6
-In order to fit linear supply and demand curves to data, we need to find the parameters, a, b, c, and d, of the corresponding functions. One procedure for finding those values uses the known values of:
(Multiple Choice)
4.9/5 (37)
The battery packs used in electric and hybrid automobiles are one of the largest cost components for manufacturing these cars. As the price of these batteries decline, we expect that the:
(Multiple Choice)
4.8/5 (45)
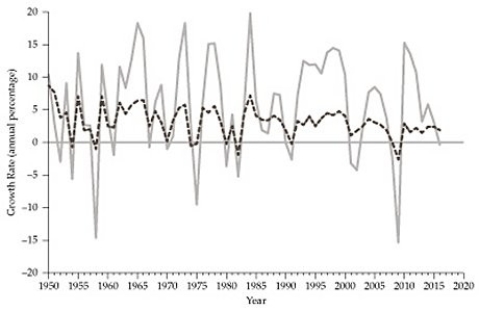 Figure 2.5.3
-An industry in which sales tend to magnify cyclical changes in gross domestic product and national income is called:
Figure 2.5.3
-An industry in which sales tend to magnify cyclical changes in gross domestic product and national income is called:
(Multiple Choice)
4.8/5 (45)
If two goods are substitutes, the cross-price elasticity of demand must be:
(Multiple Choice)
4.7/5 (33)
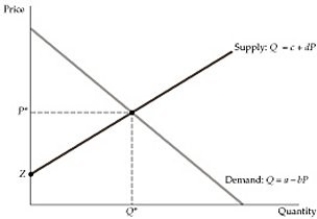 Figure 2.6.2
-When demand is written as Q = a - bP, and P* and Q* are the equilibrium values for price and quantity, which of the following is the value of the price elasticity of demand, ED?
Figure 2.6.2
-When demand is written as Q = a - bP, and P* and Q* are the equilibrium values for price and quantity, which of the following is the value of the price elasticity of demand, ED?
(Multiple Choice)
4.8/5 (40)
Suppose the equilibrium price of milk is $3 per gallon but the federal government sets the market price at $4 per gallon. The market mechanism will force the milk price back down to $3 per gallon unless the government:
(Multiple Choice)
4.9/5 (35)
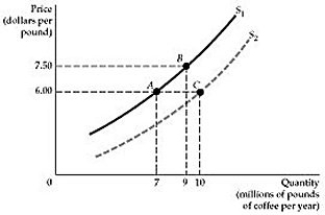 Figure 2.1.1
-Refer to Figure 2.1.1 above. Lower material costs-indeed lower costs of any kind-make production more profitable. Starting at point A, which of the following best represents this assertion?
Figure 2.1.1
-Refer to Figure 2.1.1 above. Lower material costs-indeed lower costs of any kind-make production more profitable. Starting at point A, which of the following best represents this assertion?
(Multiple Choice)
4.8/5 (40)
Assume that steak and potatoes are complements. When the price of steak goes up, the demand curve for potatoes:
(Multiple Choice)
4.8/5 (28)
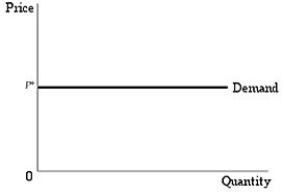 Figure 2.4.2
-Refer to Figure 2.4.2 above. Fill in the blanks. For any price higher than P*, the quantity demanded ________, while for any price lower than P*, the quantity demanded ________.
Figure 2.4.2
-Refer to Figure 2.4.2 above. Fill in the blanks. For any price higher than P*, the quantity demanded ________, while for any price lower than P*, the quantity demanded ________.
(Multiple Choice)
4.9/5 (34)
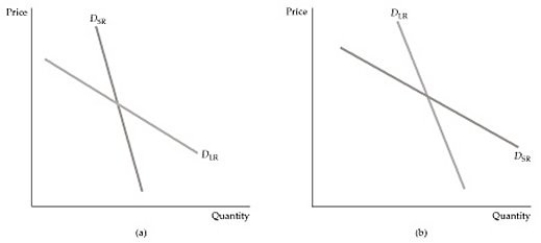 Figure 2.5.2
-Refer to Figure 2.5.2 above. Which of the following best represents the demand for cars in the short run (SR) and in the long run (LR)?
Figure 2.5.2
-Refer to Figure 2.5.2 above. Which of the following best represents the demand for cars in the short run (SR) and in the long run (LR)?
(Multiple Choice)
4.7/5 (34)
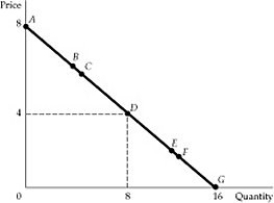 Figure 2.4.1
-Refer to Figure 2.4.1. Between points E and F, demand is:
Figure 2.4.1
-Refer to Figure 2.4.1. Between points E and F, demand is:
(Multiple Choice)
4.9/5 (31)
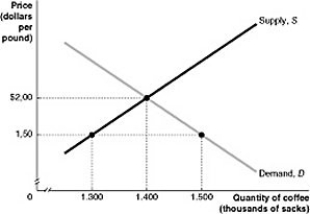 Figure 2.2.1
-Refer to Figure 2.2.1 above. At a price of $1.50, there is:
Figure 2.2.1
-Refer to Figure 2.2.1 above. At a price of $1.50, there is:
(Multiple Choice)
4.8/5 (41)
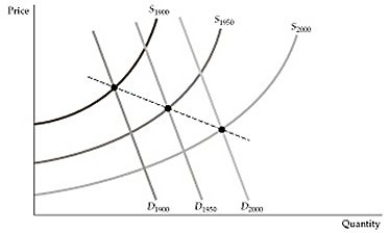 Figure 2.3.2
-Figure 2.3.2 above is a reproduction of Figure 2.9 in the textbook, which describes the market for mineral resources across time. The downward-sloping line that crosses the equilibrium points is called:
Figure 2.3.2
-Figure 2.3.2 above is a reproduction of Figure 2.9 in the textbook, which describes the market for mineral resources across time. The downward-sloping line that crosses the equilibrium points is called:
(Multiple Choice)
4.8/5 (35)
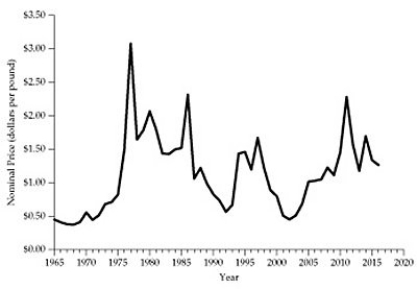 Figure 2.5.5
-Refer to Figure 2.5.5 above. The textbook attributes the changes in the price of coffee in New York to:
Figure 2.5.5
-Refer to Figure 2.5.5 above. The textbook attributes the changes in the price of coffee in New York to:
(Multiple Choice)
4.8/5 (30)
If the actual price were below the equilibrium price in the market for bread, a:
(Multiple Choice)
5.0/5 (28)
When the government controls the price of a product, causing the market price to be above the free market equilibrium price,
(Multiple Choice)
4.7/5 (29)
Figure 2.1.1
-Refer to Figure 2.1.1 above. Starting from point A, how do the firms in the market react when the price of coffee increases from $6.00 to $7.50 per pound?
(Multiple Choice)
4.9/5 (34)
Filters
- Essay(0)
- Multiple Choice(0)
- Short Answer(0)
- True False(0)
- Matching(0)