Exam 26: Statistical Process Control
Exam 1: Operations and Productivity134 Questions
Exam 2: Operations Strategy in a Global Environment145 Questions
Exam 3: Project Management131 Questions
Exam 4: Forecasting151 Questions
Exam 5: Design of Goods and Services136 Questions
Exam 6: Managing Quality139 Questions
Exam 7: Process Strategy and Sustainability141 Questions
Exam 8: Location Strategies149 Questions
Exam 9: Layout Strategies171 Questions
Exam 10: Human Resources, Job Design, and Work Measurement202 Questions
Exam 11: Supply-Chain Management152 Questions
Exam 12: Inventory Management178 Questions
Exam 13: Aggregate Planning144 Questions
Exam 14: Material Requirements Planning Mrp and Erp184 Questions
Exam 15: Short-Term Scheduling149 Questions
Exam 16: Lean Operations147 Questions
Exam 17: Maintenance and Reliability139 Questions
Exam 18: Decision-Making Tools107 Questions
Exam 19: Linear Programming110 Questions
Exam 20: Transportation Models104 Questions
Exam 21: Waiting-Line Models145 Questions
Exam 22: Learning Curves121 Questions
Exam 23: Simulation102 Questions
Exam 24: Supply Chain Management Analytics65 Questions
Exam 25: Sustainability in the Supply Chain11 Questions
Exam 26: Statistical Process Control166 Questions
Exam 27: Capacity and Constraint Management117 Questions
Select questions type
In statistical process control, the range often substitutes for the standard deviation.
(True/False)
4.8/5  (36)
(36)
Mean charts and range charts complement one another, one detecting shifts in process average, the other detecting shifts in process dispersion.
(True/False)
4.8/5 (36)
Examine the Statistical Process Control outputs below. Answer the following questions.
a. What is the sample size?
b. What is the number of samples?
c. What is the mean of sample 8; what is the range of sample 10?
d. Is this process in control? Explain-a simple Yes or No is insufficient.
e. What additional steps should the quality assurance team take? Mean Range UCL (Upper control limit) 12.6856 1.0193 CL (Center line) 12.36 0.67 LCL (Lower control limit) 10.0344 0 Sample Number Item 1 Item 2 Item 3 Item 4 Mean Range Sample 1 12.2 12.6 12 12.1 12.225 0.6 Sample 2 11.9 12.5 12.4 12.7 12.375 0.8 Sample 3 12 12.2 12.9 13.1 12.55 1.1 Sample 4 12.5 12.5 12.4 12.8 12.55 0.4 Sample 5 12.2 12.8 12.7 12 12.425 0.8 Sample 6 12.1 12.5 11.8 12.3 12.175 0.7 Sample 7 12.3 12.4 12.8 12.4 12.475 0.5 Sample 8 12 12.1 12.4 12.2 12.175 0.4 Sample 9 12.1 12.8 12.4 11.9 12.3 0.9 Sample 10 12.6 12.4 12.1 12.3 12.35 0.5
(Essay)
4.9/5 (35)
A local manufacturer supplies you with parts, and you would like to install a quality monitoring system at his factory for these parts. Historically, the defect rate for these parts has been 1.25% (You've observed this from your acceptance sampling procedures, which you would like to discontinue). Develop ± 3σ control limits for this process. Assume the sample size will be 200 items.
(Essay)
4.9/5 (38)
The acceptable quality level (AQL) is the average level of quality we are willing to accept.
(True/False)
4.8/5 (25)
A manufacturer uses statistical process control to control the quality of the firm's products. Samples of 50 of Product A are taken, and a defective/acceptable decision is made on each unit sampled. For Product B, the number of flaws per unit is counted. What type(s) of control charts should be used?
(Multiple Choice)
4.8/5 (32)
The x-bar chart, like the c-chart, is based on the exponential distribution.
(True/False)
4.8/5 (36)
The statistical definition of Six Sigma allows for 3.4 defects per million. This is achieved by a Cpk index of
(Multiple Choice)
4.7/5 (31)
A department chair wants to monitor the percentage of failing students in classes in her department. Each class had an enrollment of 50 students last spring. The number of failing students in the 10 classes offered that term were 1, 4, 2, 0, 0, 0, 0, 0, 0, and 3, respectively. Compute the control limits for a p-chart at the 95% confidence level. Is the process in control?
(Essay)
4.9/5 (26)
If μ = 9 ounces, σ = 0.7 ounces, and n = 9, calculate the 3-sigma control limits.
(Short Answer)
4.9/5 (33)
The width of a gold bar is intended to be 0.42 cms. Inspection samples contain six bars each. The average range of these samples is 0.007 cms. What are the upper and lower control limits for the x-bar and R-chart for this process, using 3-sigma limits?
(Essay)
4.7/5 (43)
A normal distribution is generally described by its two parameters: the mean and the range.
(True/False)
4.9/5 (42)
The type of inspection that classifies items as being either good or defective is
(Multiple Choice)
4.9/5 (35)
A city police chief decides to do an annual review of the police department by checking the number of monthly complaints. If the total number of complaints in each of the 12 months were 15, 18, 13, 12, 16, 20, 5, 10, 9, 11, 8, and 3 and the police chief wants a 90% confidence level, are the complaints in control?
(Essay)
4.9/5 (39)
Pierre's Motorized Pirogues and Mudboats is setting up an acceptance sampling plan for the special air cleaners he manufactures for his boats. His specifications, and the resulting plan, are shown on the POM for Windows output below. Pierre wants acceptance sampling to remove ALL defects from his production of air cleaners. Explain carefully why this won't happen. 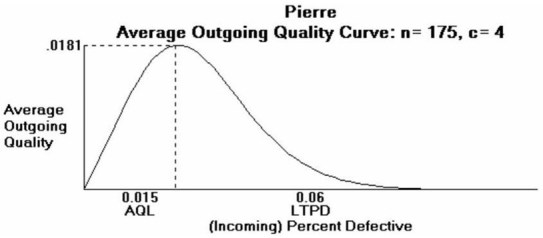
(Essay)
4.8/5 (35)
An operator trainee is attempting to monitor a filling process that has an overall average of 705 cc. The average range is 17 cc. If you use a sample size of 6, what are the upper and lower control limits for the x-bar and R chart?
(Essay)
4.7/5 (46)
Filters
- Essay(0)
- Multiple Choice(0)
- Short Answer(0)
- True False(0)
- Matching(0)