Exam 13: Chi-Square Tests
Exam 1: An Introduction to Business Statistics and Analytics98 Questions
Exam 2: Descriptive Statistics and Analytics: Tabular and Graphical Methods120 Questions
Exam 3: Descriptive Statistics and Analytics: Numerical Methods145 Questions
Exam 4: Probability and Probability Models150 Questions
Exam 5: Predictive Analytics I: Trees, K-Nearest Neighbors, Naive Bayes,101 Questions
Exam 6: Discrete Random Variables150 Questions
Exam 7: Continuous Random Variables150 Questions
Exam 8: Sampling Distributions111 Questions
Exam 9: Confidence Intervals149 Questions
Exam 10: Hypothesis Testing150 Questions
Exam 11: Statistical Inferences Based on Two Samples140 Questions
Exam 12: Experimental Design and Analysis of Variance132 Questions
Exam 13: Chi-Square Tests120 Questions
Exam 14: Simple Linear Regression Analysis147 Questions
Exam 15: Multiple Regression and Model Building85 Questions
Exam 16: Predictive Analytics Ii: Logistic Regression, Discriminate Analysis,101 Questions
Exam 17: Time Series Forecasting and Index Numbers161 Questions
Exam 18: Nonparametric Methods103 Questions
Exam 19: Decision Theory90 Questions
Select questions type
In a contingency table, when all the expected frequencies equal the observed frequencies, the calculated χ2 statistic equals zero.
Free
(True/False)
4.8/5  (31)
(31)
Correct Answer: Verified
True
A survey was conducted on the age and gender of the purchasers of a specific automotive model. The results are below.
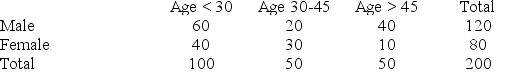 For each column total, calculate the corresponding percentage.
Free
(Short Answer)
4.8/5 (34)
Correct Answer:Verified
Age < 30: 50%; Age 30-45: 25%; Age > 45: 25%
In the past, of all the students enrolled in Basic Business Statistics, 10 percent earned an A, 20 percent earned a B, 30 percent earned a C, 20 percent earned a D, and the remainder failed the course. Dr. Johnson is a new professor teaching Basic Business Statistics for the first time this semester. At the conclusion of the semester, of his 60 students, 10 had earned an A, 20 a B, 20 a C, 5 a D, and 5 received an F. Assume that the class constitutes a random sample. Dr. Johnson wants to know if there is sufficient evidence to conclude that the grade distribution of his class is different from the historical grade distribution. If we assume at α = .05 and that the null hypothesis is rejected, make a one-sentence managerial conclusion.
Free
(Short Answer)
4.8/5 (36)
Correct Answer:Verified
The class grades are different than the historical course grade distribution.
A study of car accidents and drivers who use cell phones collects the following sample data.
 Determine the expected frequencies of those who had accidents in the last year to use for the chi-square test of independence.
(Short Answer)
4.9/5 (36)
AAA Co. operates distribution centers in the Midwest. Three of their centers were recently audited to determine if they are in compliance with company standard billing procedures. According to the auditing firm, a billing had an equal probability of being from each of the three centers. A random sample of the audited billings had the following distribution.
Center 1: 385 billings
Center 2: 305 billings
Center 3: 210 billings
What are the degrees of freedom for the χ2 test?
(Short Answer)
4.9/5 (34)
One use of the chi-square goodness-of-fit test is to determine if specified multinomial probabilities in the null hypothesis are favored over the alternative hypothesis.
(True/False)
4.7/5 (29)
AAA Co. operates distribution centers in the Midwest. Three of their centers were recently audited to determine if they are in compliance with company standard billing procedures. According to the auditing firm, a billing had an equal probability of being from each of the three centers. A random sample of the audited billings had the following distribution.
Center 1: 385 billings
Center 2: 305 billings
Center 3: 210 billings
State the null hypothesis that states the expectations of the auditors.
(Short Answer)
4.7/5 (36)
When we carry out a chi-square test of independence, if ri is the row total for row i and cj is the column total for column j, then the estimated expected cell frequency corresponding to row i and column j equals (ri)(cj)/n.
(True/False)
4.7/5 (37)
Consider a set of 50 measurements with mean 50.2 and standard deviation 18.7 and with the following observed and expected frequencies.
 It is desired to test whether these measurements came from a normal population. Calculate the value of the chi-square test statistic.
(Short Answer)
4.8/5 (32)
A paper presented at a recent meeting of higher education researchers compared the type of college freshmen attend and the numbers who drop out. A random sample of freshmen shows the following results.
 Use a significance level of .05 and determine if the type of school and the drop rate are independent. Null hypothesis is that dropout rate is independent of type of school.
(Short Answer)
4.8/5 (33)
Consider a set of 50 measurements with mean 50.2 and standard deviation 18.7 and with the following observed frequencies.
 It is desired to test whether these measurements came from a normal population. How many degrees of freedom are associated with the chi-square test?
(Short Answer)
4.8/5 (32)
In the past, of all the students enrolled in Basic Business Statistics, 10 percent earned an A, 20 percent earned a B, 30 percent earned a C, 20 percent earned a D, and the remainder failed the course. Dr. Johnson is a new professor teaching Basic Business Statistics for the first time this semester. At the conclusion of the semester, of his 60 students, 10 had earned an A, 20 a B, 20 a C, 5 a D, and 5 received an F. Assume that the class constitutes a random sample. Dr. Johnson wants to know if there is sufficient evidence to conclude that the grade distribution of his class is different from the historical grade distribution. Calculate the expected values for a B and for a C.
(Short Answer)
4.8/5 (30)
In the past, of all the students enrolled in Basic Business Statistics, 10 percent earned an A, 20 percent earned a B, 30 percent earned a C, 20 percent earned a D, and the remainder failed the course. Dr. Johnson is a new professor teaching Basic Business Statistics for the first time this semester. At the conclusion of the semester, of his 60 students, 10 had earned an A, 20 a B, 20 a C, 5 a D, and 5 received an F. Assume that the class constitutes a random sample. Dr. Johnson wants to know if there is sufficient evidence to conclude that the grade distribution of his class is different from the historical grade distribution. Calculate the expected values for an A and for a D.
(Short Answer)
4.8/5 (38)
A manufacturing company produces part QV2Y for the aerospace industry. This particular part can be manufactured using 3 different production processes. The management wants to know if the quality of the units of part QV2Y is the same for all three processes. The production supervisor obtained the following data: Process 1 had 29 defective units in 240 items, Process 2 produced 12 defective units in 180 items, and Process 3 manufactured 9 defective units in 150 items. Chi-Square Contingency Table Test for Independence
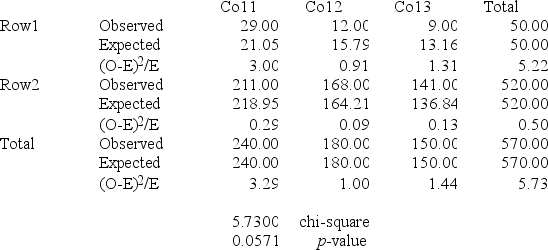 At a significance level of .10, the management wants to perform a hypothesis test to determine if the quality of the items produced appears to be independent of the production process used. Based on the results summarized in the MegaStat/Excel output provided in the table above, we
(Multiple Choice)
4.9/5 (36)
A human resource manager is interested in whether absences occur during the week with equal frequency. The manager took a random sample of 100 absences and created the following table.
 At a significance level of .05, test H0: the probabilities are equal for all five days. What is your conclusion?
(Short Answer)
4.8/5 (31)
In performing a chi-square test of independence, as the difference between the respective observed and expected frequencies calculated by assuming independence decreases, the probability of concluding that the row variable is independent of the column variable decreases.
(True/False)
4.7/5 (26)
The AAA Co. is interested in the level of satisfaction of their employees with the benefit package that they offer compared to their major competitors. A consultant hired to conduct the satisfaction survey told AAA Co. that the distribution of level of satisfaction at other companies is displayed below.
 A survey of 125 AAA employees gave the following results.
 What is the null hypothesis to test if the distribution of satisfaction is the same at AAA as at their competitors?
(Short Answer)
4.9/5 (40)
A U.S.-based company offers an online proficiency course in basic accounting. Completing this online course satisfies the Fundamentals of Accounting course requirement in many MBA programs. In the first semester, 315 students have enrolled in the course. The marketing research manager divided the country into seven regions of approximately equal population. The course enrollment values for each of the seven regions are given below. The management wants to know if there is equal interest in the course across all regions.
 At a significance level of .05, test H0: the probabilities are equal for all seven regions.
(Short Answer)
4.8/5 (35)
The chi-square goodness-of-fit is ________ a one-tailed test with the rejection region in the right tail.
(Multiple Choice)
4.9/5 (43)
On the most recent tax cut proposal, a random sample of Democrats and Republicans in the Congress cast their votes as follows.
 Determine the expected frequencies for both the Democrats and Republicans who oppose the tax cut proposal for the chi-square test of independence.
(Short Answer)
4.9/5 (39)
Filters
- Essay(0)
- Multiple Choice(0)
- Short Answer(0)
- True False(0)
- Matching(0)